
Figures & data
Figure 1 Trial protocol.
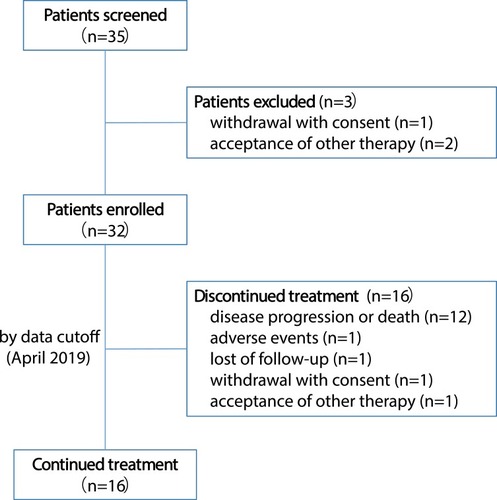
Table 1 Baseline Characteristics
Figure 2 Kaplan–Meier estimates of progression-free survival (PFS) and overall survival (OS).
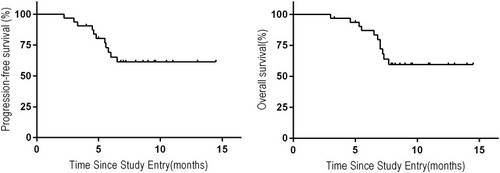
Figure 3 Waterfall plot of best percentage changes from baseline. Waterfall plot of the best percentage changes from baseline of target tumor size is shown for each patient. Dashed line at −50% represents the threshold of partial response, and another dashed line at 50% represents the threshold of progressive disease. One patient had tumor shrinkage despite of progressive disease. One patient had no tumor size change from baseline.
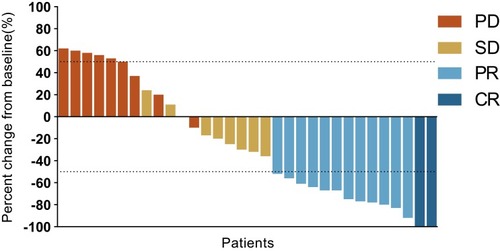
Table 2 Treatment-Related Adverse Events Occurred in More Than One Patient
Table 3 Dose Adjustments and First Dose Interruption Since Entry
Table 4 Comparison Between No Dose Reduction Group and Dose Reduction Group