Figures & data
Figure 1 Chemical structure of berberine.
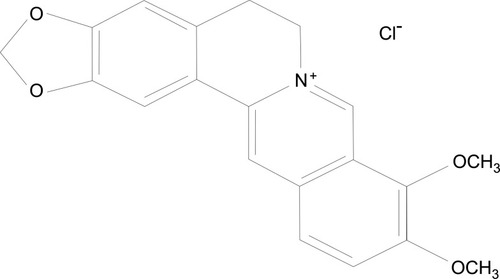
Table 1 MICs of Berberine and Fluconazole for Standard Strains and Clinical Isolates of Candida Spp. In Planktonic Condition
Figure 2 Evaluation of the inhibitory effects of berberine against Candida spp. in planktonic condition using the CLSI M27-A3 reference method. (A) Results for standard Candida strains. (B) Results for clinical isolates of Candida spp. No yeast cells were observed to grow in the wells at the MICs or higher concentrations.
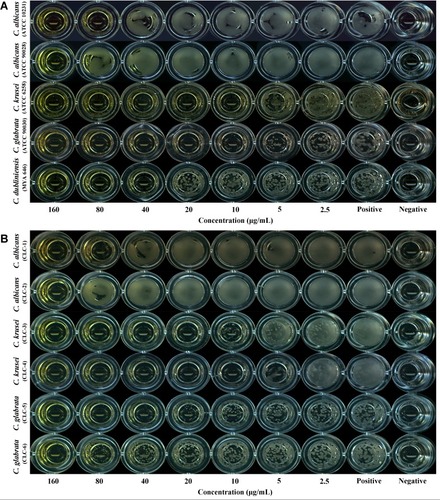
Figure 3 Evaluation of biofilm metabolic activity by XTT reduction assay. The concentration-absorbance curves for Candida biofilms at four time-points (6, 12, 24, and 48 h). The trend of the concentration–absorbance curve at the four time points decreased with the increase in berberine concentrations.
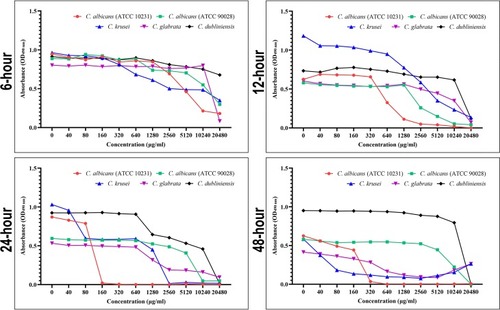
Figure 4 The overall metabolic activity of Candida biofilms at four time-points (6, 12, 24, and 48 h) was determined using the mean OD values at all berberine concentrations. With the prolongation of drug action time, the mean OD values were decreased broadly, especially for C. krusei and C. glabrata.
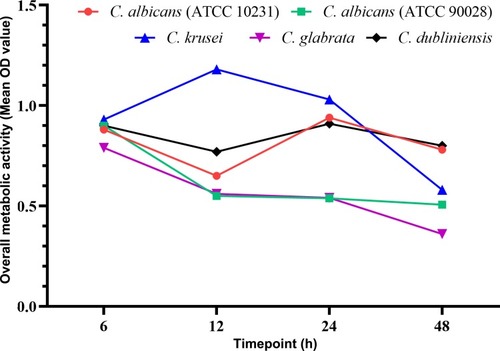
Figure 5 The inflection points of berberine for different Candida biofilms at four time-points (6, 12, 24, and 48 h). (A) C. albicans (ATCC 10231); (B) C. albicans (ATCC 90028); (C) C. krusei (ATCC 6258); (D) C. glabrata (ATCC 90030); (E) C. dubliniensis (MYA 646). (F) Comparison of the inflection points between the five Candida strains. The inflection points of the five strains changed from 6 h to 48 h. Most values were altered significantly from 6 h to 24 h, and tended to be steady from 24 h to 48 h. Moreover, the inflection points for C. krusei remained the lowest among all five Candida strains at each time point.
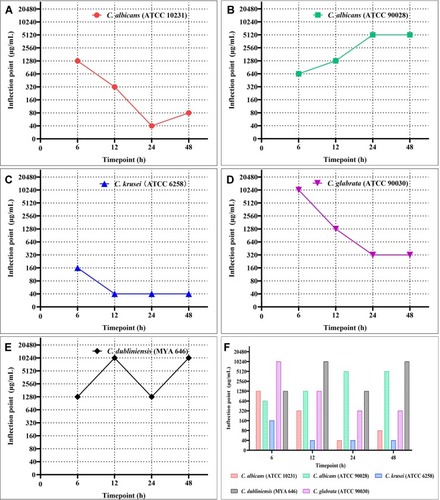
Figure 6 Evaluation of the inhibitory effects of berberine against mature Candida biofilms by CLSM. Live yeasts with intact cell membranes were stained fluorescent green, whereas dead yeasts with damaged membranes were stained fluorescent red. The gross number of dead Candida cells in the berberine-treated groups increased significantly compared with that in the live control groups, especially for C. krusei and C. glabrata.
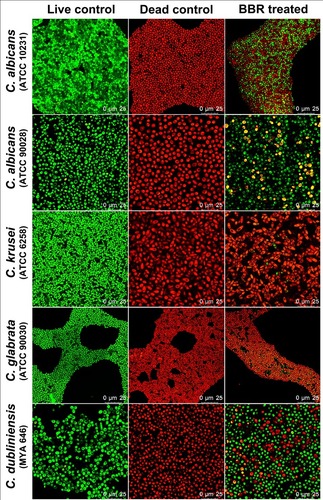
Figure 7 The viability inhibition rates of Candida biofilms. (A) Biofilm viability results presented by CFU growth on SDA plates. The CFU of the berberine-treated groups decreased significantly compared with that of the live control group. (B) Comparison of the viability inhibition rates between CLSM groups and CFU groups. There was no significant difference between the CLSM groups and CFU groups (P > 0.05). The five Candida strains were significantly different (P < 0.001). The data represent the means ± SD of three biological replicates from one representative experiment out of two independent experiments with similar results. ns, P > 0.05.
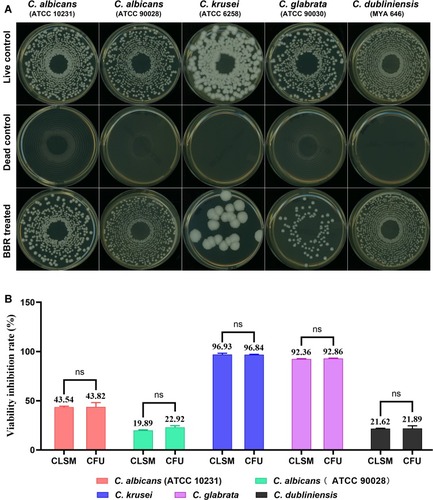
Figure 8 Evaluation of the inhibitory effects of berberine on the spatial structures of mature Candida biofilms by 3-D reconstruction. The image intuitively shows the biofilm composition and structure. The berberine-treated groups had biofilms with poorly developed architecture, lower cell densities, and loosely packed cells.
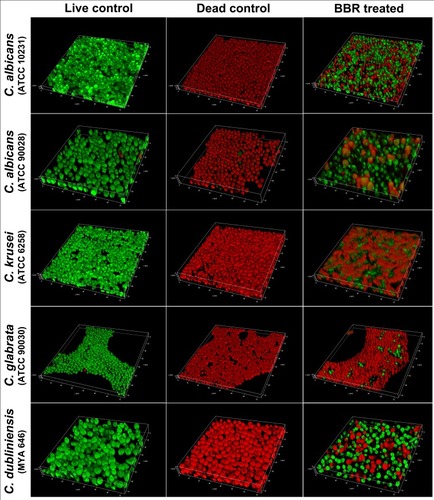
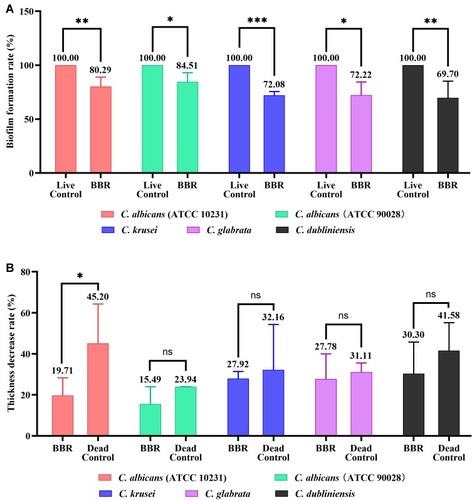
Figure 9 (A) Candida biofilm formation rates. The biofilm formation rates of the berberine-treated groups were significantly decreased in comparison with that of the live control groups (P < 0.05). (B) Biofilm thickness decrease rates. C. dubliniensis and C. krusei showed high rates, followed by C. glabrata, C. albicans ATCC 10231, and C. albicans ATCC 90028. The five Candida strains had significantly different thickness decrease rates (P < 0.05). The data represent the means ± SD of three biological replicates from one representative experiment out of two independent experiments with similar results. *, P < 0.05; **, P < 0.001; ***, P < 0.0001; ns, P > 0.05.