Figures & data
Figure 1 Chemical structure of naproxen.
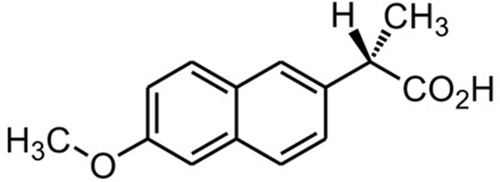
Table 1 Process Parameter and Compositions of NP Loaded PHE-Ms
Figure 2 Minimized structures of polymers, surfactants, and NP.
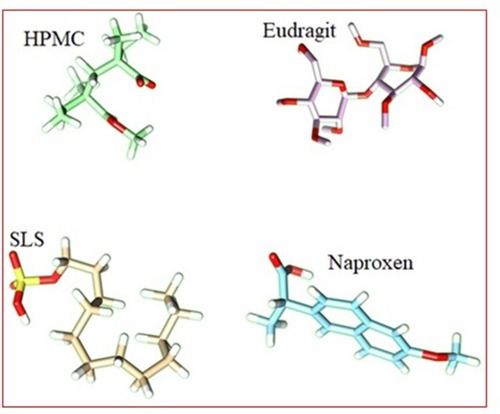
Table 2 Composition of NP Loaded PHE-Ms Based Tablets Formulations (MT1-MT5)
Table 3 Particle Size (μm) and Span Index of NP Loaded PHE-MS of Formulations (M1–M5)
Figure 3 (A) FTIR spectra for NP (Unprocessed) and (B) NP-M1 optimized formulation.
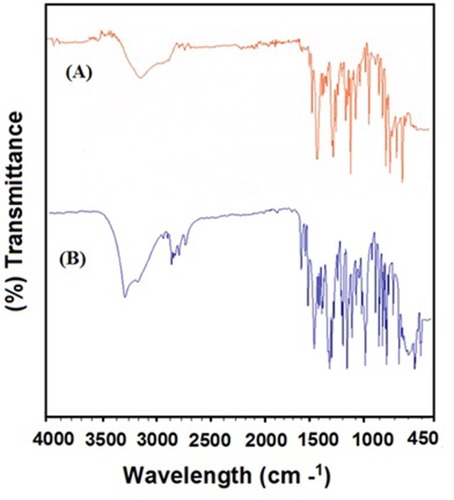
Figure 4 (A) Unprocessed NP at magnification of 500× and (B) NP-M1 optimized formulation (2000×).
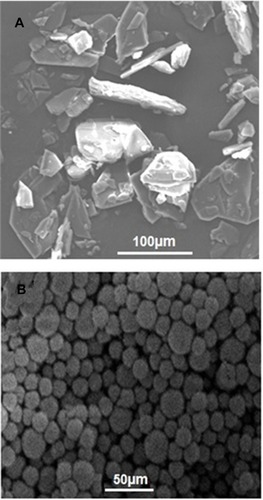
Figure 5 P-XRD pattern of NP (Unprocessed), NP-PM, NP-M1, EUD, and HPMC.
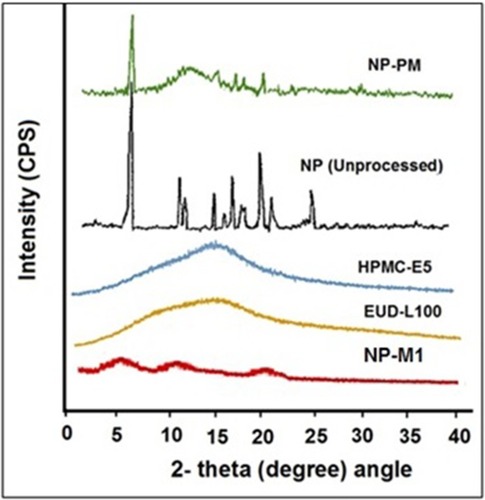
Figure 6 DSC Thermograms of NP (Unprocessed) and NP-M1.
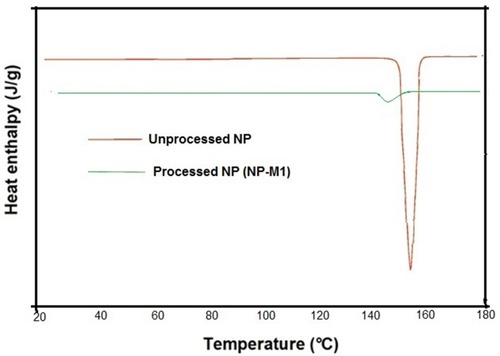
Table 4 Impact of Formulation Variables on (%) Yield, Drug Loading, and Encapsulation Efficiency on Formulations (M1-M5)
Table 5 Binding Energies Calculations for Different Co-Polymeric Systems of SLS, Eudragit (EUD), HPMC and Naproxen (NP)
Figure 7 3D surface and structure representation of SLS and Eudragit complex (A). 3D surface and structure representation of SLS-Eudragit (host) and HPMC (guest) complex structure (B). 3D surface and structure representation of SLS-Eudragit-HPMC host) and Naproxen (guest) complex structure (C).
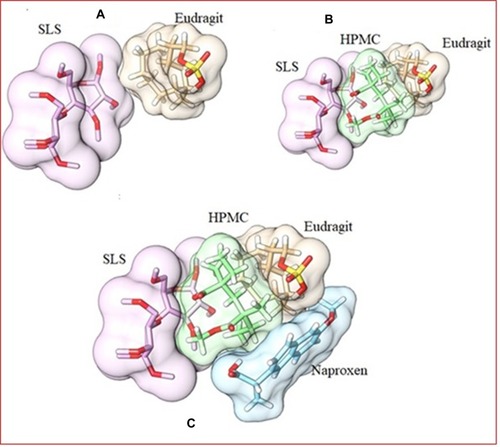
Figure 8 (A) Drug release from formulations of NP (MT1-MT5) at pH 6.8. (B) Drug release from formulations of NP (MT1-MT5) at pH 1.2. (C) Comparative drug release profile of NP (Marketed Drug), NP (Unprocessed) and NP-MT1 at pH1.2 and pH 6.8.
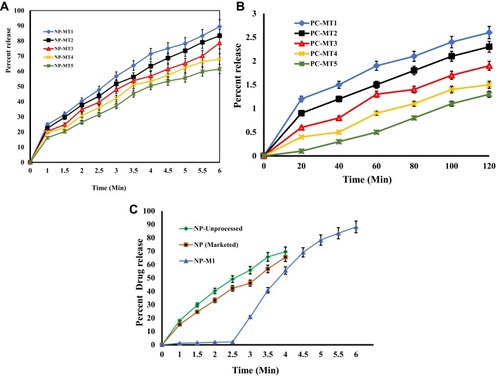
Table 6 Modulation and the Model Equations Applied to the in- Vitro Release Kinetics of PHE-Ms Based Tablets Respectively; the Correlation Coefficient (R2); the Release Exponent (n) of the Korsmeyer–Peppas Model
Table 7 Pharmacokinetics Parameters for NP (Unprocessed), NP (Marketed Drug), and NP MT1 Formulation in Rats
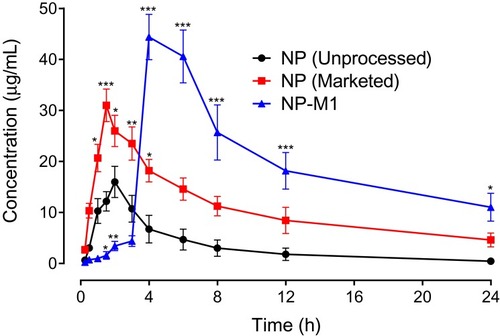
Figure 9 Pharmacokinetic profile of NP (Unprocessed), NP (Marketed drug) and NP-MT1 in rats. The plot of plasma concentration (µg/mL) versus time (h). Data represented as mean ± SEM. *P < 0.05, **P < 0.01, ***P < 0.001 in contrast to NP (Unprocessed) treated animals group at respective time-period; two-way repeated-measures ANOVA followed by post hoc Bonferroni’s analysis was used.