Figures & data
Figure 1 Chemical Structure of (A) CLBQ14 and (B) Clioquinol. CLBQ14 and CQ are congeners of 8-hydroxyquinoline that differ from each other only by the halogen at position C7.
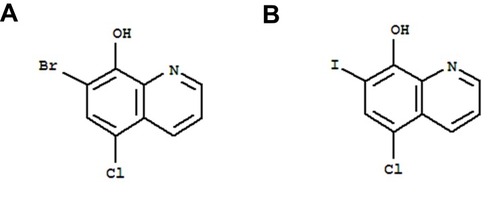
Figure 2 Representative HPLC-UV Chromatograms for CLBQ14 and clioquinol (IS) in Solution.
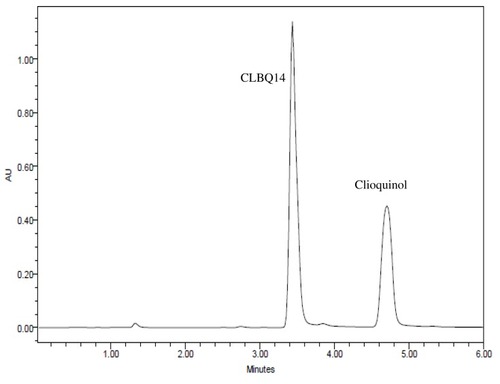
Table 1 Intra- and Inter-Day Accuracy and Precision of HPLC-UV Method
Figure 3 Solubility of CLBQ14 in various solvents at room temperature. Mean of n = 3.
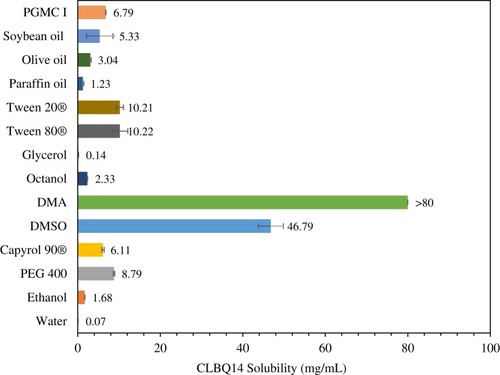
Table 2 Degradation Rate Constants and Half-Life of CLBQ14 at Various pH
Figure 4 Stability of CLBQ14 in various pH buffers at 37oC. Data is expressed as mean of n = 3.
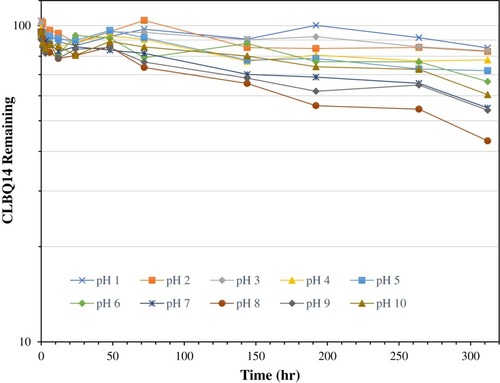
Figure 5 pH degradation rate profile for CLBQ14 in various USP buffers at 37 °C.
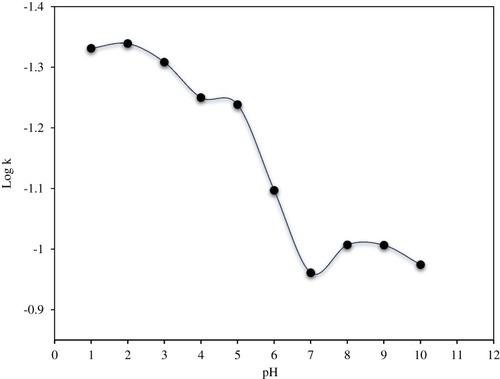
Table 3 Microsomal Stability and Predicted Plasma Clearance of CLBQ14
Figure 6 Microsomal stability of CLBQ14 following incubation in liver microsomes from CD-1 mouse, SD rat, cynomolgus monkey and human at 37 °C for 60 mins. (A) Rate of CLBQ14 disappearance. (B) Percent CLBQ14 remaining after incubation. (Error bar = standard deviation).
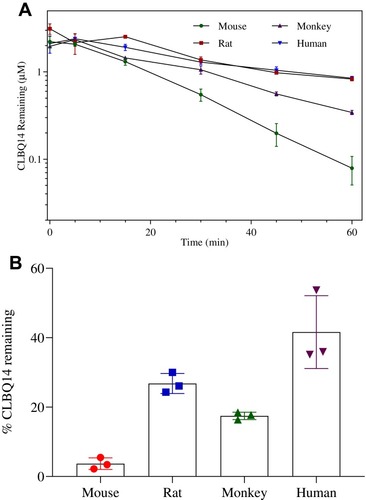
Figure 7 CYP Phenotyping of CLBQ14 following incubation in rhCYPs at 37°C for 60 mins. (A) CLBQ14 disappearance. (B) Percent CLBQ14 remaining after incubation. (Error bar = standard deviation).
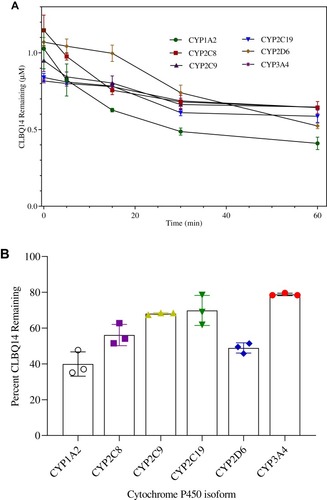
Table 4 CLBQ14 Pharmacokinetic Parameters Generated by Non-Compartmental Analysis
Figure 8 Concentration versus time profile of CLBQ14 following the administration of 2 mg/kg IV bolus, 10 mg/kg PO and 20 mg/kg SC doses to SD rats (n=3 each, error bar = standard deviation).
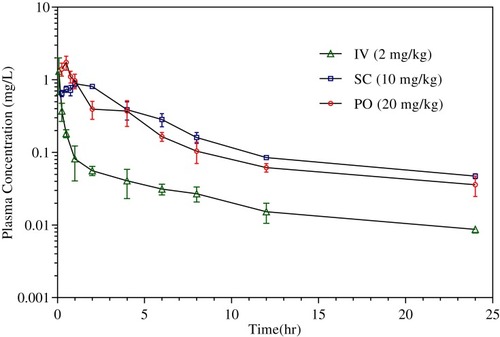
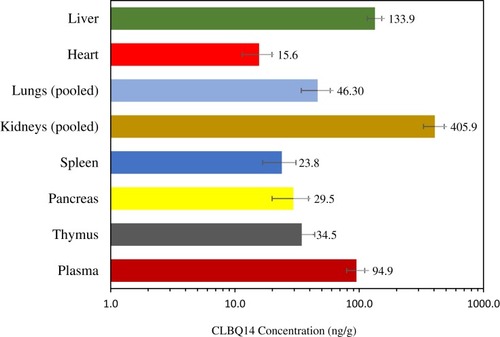
Table 5 Tissue-to-Plasma Ratio (Kp) of CLBQ14. Tissue and Plasma Samples Were Collected 2 h After a Single 5 mg/kg IV Bolus of CLBQ14
Figure 9 Tissue distribution of CLBQ14 at 2 hrs following an IV bolus dose of 5 mg/kg to SD rats (error bar = standard deviation).