Figures & data
Figure 1 Ufm1 expression in RAW264.7 cells. (A) Relative mRNA levels of Ufm1 in the control, Lv-NC, Lv-Ufm1, Lv-shNC and Lv-shUfm1 groups were measured by qRT-PCR. (B) The protein levels of Ufm1 in the control, Lv-NC, Lv-Ufm1, Lv-shNC and Lv-shUfm1 groups were assayed by Western blot analysis, and GAPDH was used as an internal control. (C) Relative protein levels of Ufm1 in the control, Lv-NC, Lv-Ufm1, Lv-shNC and Lv-shUfm1 groups were measured by Western blot analysis. The data are presented as the mean±SD, n=3. ***P<0.001 compared to the Lv-NC group, ###P<0.001 compared to the Lv-shNC group, ΔΔΔP<0.001 compared to the Lv-Ufm1 group.
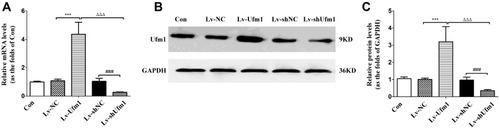
Figure 2 Effects of Ufm1 on the levels of IL-6, IL-1β, ICAM-1, VCAM-1, MCP-1, and CXCL2 in RAW264.7 cells. RAW264.7 cells were transfected with lentivirus carrying Lv-shUfm1, Lv-shNC, Lv-Ufm1, and Lv-NC and treated with LPS (1000 ng/mL) and TNF-α (20 ng/mL) for 24 h. The levels of the mediators were assayed by commercial ELISA kits. (A) IL-1β; (B) IL-6; (C) ICAM-1; (D) MCP-1; (E) VCAM-1; and (F) CXCL2. The data are presented as the mean±SD, n=3. **P<0.01, ***P<0.001 compared to the Lv-NC group; #P<0.05, ##P<0.01 compared to the Lv-shNC group; ΔΔΔP<0.001 compared to the Lv-Ufm1 group.
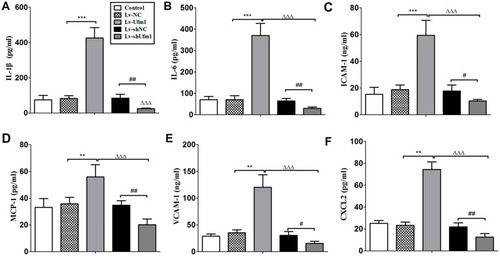
Figure 3 Effects of Ufm1 on NF-κB p65 expression in RAW264.7 cells. Immunoblotting results showing cytoplasmic (A) and nuclear (B) NF-κB p65 expression in Lv-shUfm1-, Lv-shNC-, Lv-Ufm1- and Lv-NC-treated RAW264.7 cells. LPS: 1000 ng/mL; TNF-α: 20 ng/mL. The levels of cytoplasmic (A1-A2) and nuclear (B1-B2) p65 were quantified and are shown as the fold change compared to the control (0 min). The data are presented as the mean±SD, n=3. ***P<0.001 compared to the Lv-shNC group; ##P<0.01 compared to the Lv-NC group.
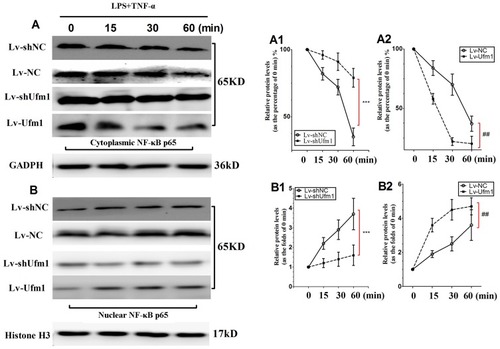
Figure 4 Effects of Ufm1 on NF-κB p65 and p-p65 nuclear translocation in RAW264.7 cells. Immunocytochemical images of NF-κB p65 (A) and p-p65 (B) showing its expression and nuclear translocation in cells treated with LPS and TNF-α for 60 min. LPS: 1000 ng/mL; TNF-α: 20 ng/mL. Green fluorescence indicates localization of the NF-κB p65 or p-p65 subunit, while blue fluorescence indicates nuclear DAPI staining. Magnification: 400×. Representative images of three independent experiments are shown.
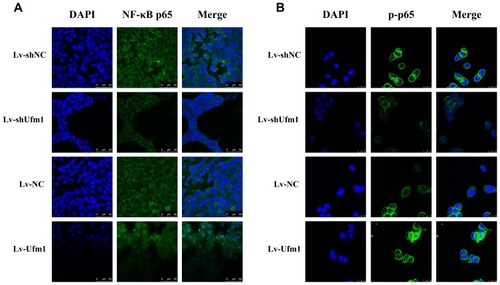
Figure 5 Ufm1 promotes TNF/LPS-dependent NF-κB activation by promoting the ubiquitination and degradation of IκBα. (A) Effects of Ufm1 on p-IKK and p-IκBα levels in RAW264.7 cells; (B) Effects of Ufm1 on the ubiquitination of IκBα. The cells were incubated with 50 µg/mL ALLN for 30 min and then treated with LPS (1000 ng/mL) and TNF-α (20 ng/mL). Cytoplasmic extracts were fractionated and then subjected to Western blot analysis using specific anti-IκBα antibodies. (C) Effects of Ufm1 on the degradation of IκBα. IκBα levels were quantified and are shown as the fold change compared to the control at 0 min. The data are presented as the mean±SD, n=3. **P<0.01 compared to the Lv-shNC group; ##P<0.01 compared to the Lv-NC group.
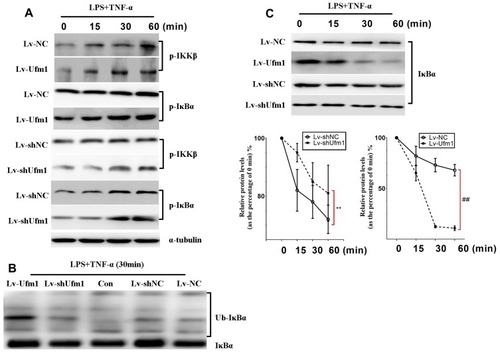
Figure 6 Effects of Ufm1 on the levels of inflammatory mediators and NF-κB p65 nuclear translocation in the RPMs of db/db mice. (A). Levels of Ufm1 in RPMs from each group; (B). mRNA expression of pro-inflammatory cytokines (TNF-α, IL-1β, and IL-6), chemokines (MCP-1 and CXCL2) and adhesion molecules (ICAM-1 and VCAM-1) were quantified by using qRT-PCR. For each gene, the mean level was divided by the respective mean of the wild-type; (C). Immunoblotting results showing cytoplasmic and nuclear NF-κB p65 expression in RPMs of the con, Lv-shUfm1, Lv-shNC, Lv-Ufm1 and Lv-NC groups. The expression of cytoplasmic (C1) and nuclear (C2) p65 was quantified and is shown as the fold change compared to the internal control (histone). The data are represented as the mean±SD, n=6. **P<0.01 compared to the control (wild type) group; #P<0.05, ##P<0.01 compared to the Lv-NC group; ΔΔP<0.01 compared to the Lv-shNC group.
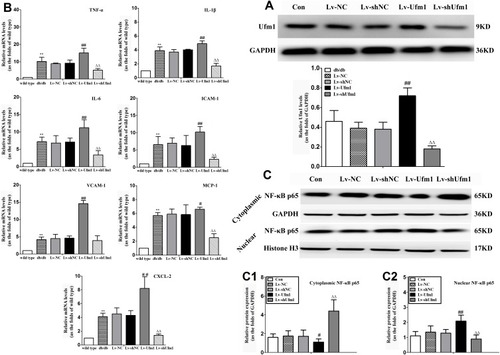
Figure 7 Effects of Ufm1 on diabetic performance and plasma inflammatory cytokines in db/db mice. (A) At 0, 2, 6 and 12 weeks after injection, blood glucose was detected using a Roche automatic biochemical analyser; (B) Body weight, **P<0.01 compared to the Lv-shNC or Lv-NC group, ##P<0.01 compared to the wild-type group, NS: not significant; (C) The plasma levels of TNF-α, IL-1β, IL-6 and MCP-1 were assayed by commercial ELISA kits. The data are presented as the mean±SD, n=6. **P<0.01 compared to the wild-type group; #P<0.05, ##P<0.01 compared to the Lv-NC group; ΔP<0.05, ΔΔP<0.01 compared to the Lv-shNC group, NS: not significant.
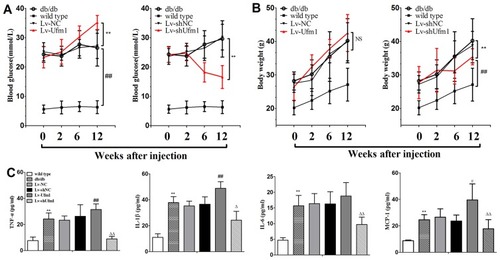
Figure 8 Effects of Ufm1 on pancreatic pathology and macrophage infiltration in db/db mice. H&E staining of pancreatic tissue from db/db mice, and islet size was measured by ImageJ analysis software on alternating pancreatic sections spaced 50 μm apart. Representative pathological pictures of the wild-type (A1), db/db (A2), Lv-NC (A3), Lv-shNC (A4), Lv-Ufm1 (A5), and Lv-shUfm1 groups (A6) and the statistical analysis (A7) are shown. Immunohistochemical analysis of pancreatic sections stained with anti-F4/80 antibody is shown in (B). Representative pictures are provided of the wild-type (B1), db/db (B2), Lv-NC (B3), Lv-shNC (B4), Lv-Ufm1 (B5) and Lv-shUfm1 groups (B6). The statistical results are shown in (B7). The data are presented as the mean±SD, n=6. **P<0.01 compared to the wild-type group; ΔP<0.05, ΔΔP<0.01 compared to the Lv-NC group; #P<0.05, ##P<0.01 compared to the Lv-shNC group.
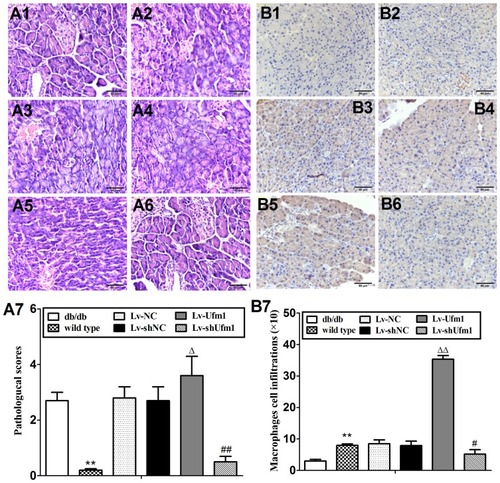
Figure 9 Effects of Ufm1 on spontaneous renal damage in db/db mice. (A). Urinary protein excretion; the data are presented as the mean±SD, n=6, ΔΔP<0.01 compared to the wild-type group; **P<0.01 compared to the Lv-Ufm1 group; ##P<0.01 compared to the Lv-shUfm1 group; (B) Representative renal pathological pictures of the wild-type (B1), db/db (B2), Lv-NC (B3), Lv-shNC(B4), Lv-Ufm1 (B5) and Lv-shUfm1 groups (B6); (B7) shows the pathological scores of each group; (C) Representative renal immunohistochemical pictures of the wild-type (C1), db/db (C2), Lv-NC (C3), Lv-shNC (C4), Lv-Ufm1 (C5) and Lv-shUfm1 groups (C6); (C7) shows the numbers of positive macrophages. The data are presented as the mean±SD, n=6. **P<0.01 compared to the wild-type group, ΔP<0.05, ΔP<0.01 compared to the Lv-NC group; ##P<0.01 compared to the Lv-shNC group.
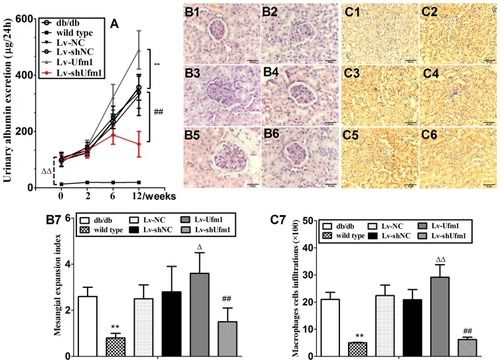
Figure 10 Effects of Ufm1 on diabetic cardiomyopathy in db/db mice. (A). Ventricular index; (B) Representative myocardial pathological pictures of the wild-type (B1), db/db (B2), Lv-NC (B3), Lv-shNC (B4), Lv-Ufm1 (B5) and Lv-shUfm1 groups (B6); (B7) shows the pathological scores of each group; (C) Representative renal immunohistochemical pictures of the wild-type (C1), db/db (C2), Lv-NC (C3), Lv-shNC (C4), Lv-Ufm1 (C5) and Lv-shUfm1 groups (C6); (C7) shows the numbers of positive macrophages in each group. The data are presented as the mean±SD, n=6. **P<0.01 compared to the wild-type group; ΔΔP<0.01 compared to the Lv-NC group; #P<0.05, ##P<0.01 compared to the Lv-shNC group.
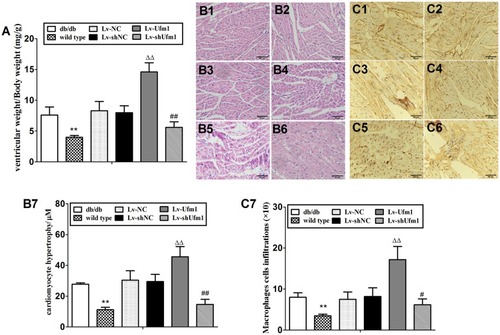
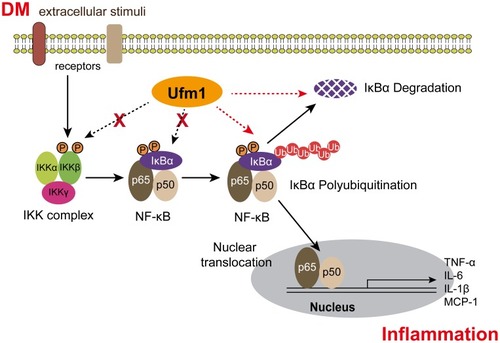
Figure 11 A brief schematic of the molecular mechanism involved in the present study. Ufm1 does not affect the phosphorylation of IKKβ or IκBα but affects the ubiquitination and degradation of IκBα to regulate NF-κB activity.