
Figures & data
Figure 1 Schematics for study design.
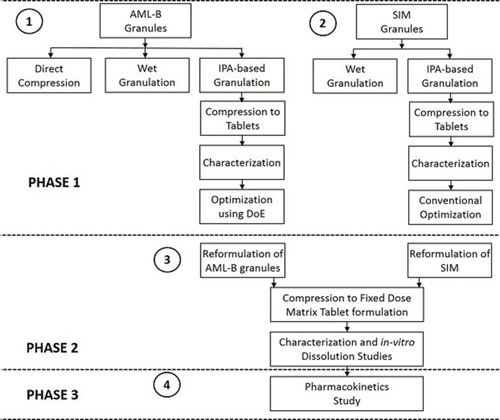
Table 1 Composition of AML-B and SIM Tablets for Pilot Study
Table 2 Design Matrix for Optimization of Amlodipine Tablet
Table 3 Quality Target Product Profile and Identification of Critical Quality Attributes
Table 4 FMEA Risk Assessment of Fixed Dose Single Tablet Formulation of Amlodipine Besylate and Simvastatin
Table 5 Composition of Fixed Dose Tablet Formulation of AML-B and SIM
Table 6 Physical Characteristics of AML-B and SIM Tablets
Table 7 Physical Characteristics of Pilot Batches of AML-B and Simvastatin (Mean n = 10)
Table 8 In-vitro Release at Different Time Intervals of AML-B Tablets with R2 Values of Release Models
Figure 2 Combined effect of Eudragit and DCP on the release of AML-B at different time intervals in: (A) screening study and (B) optimization study.
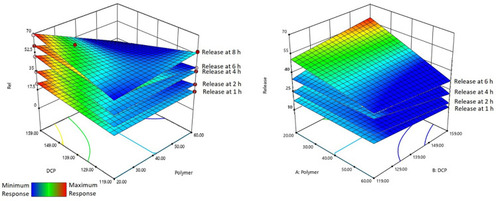
Figure 3 Behavior of simvastatin tablets after 2 h exposure (A) 0.01 N HCl (B) phosphate buffer.
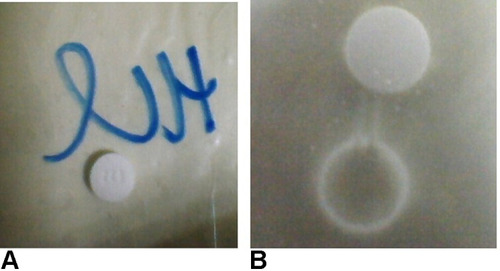
Figure 4 In-vitro release of tablets at different time intervals (A) AML-B tablets in 0.1 N HCL (B) SIM tablets in 0.1 N HCL + 0.5% sodium dodecyl sulfate and SIM tablets in phosphate buffer containing 0.5% sodium dodecyl sulfate.
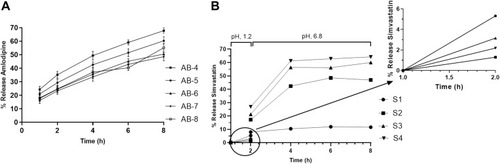
Table 9 Release of Different Formulation of AML-B at Specified Time Intervals (Mean, n = 3)
Table 10 Physical Characteristics and In-vitro Release of Validation Formulation of AML-B Tablet
Figure 5 Factor levels adjustment to achieve predicted release at (A) 1 h (B) 2 h (C) 4 h (D) 6 h (E) 8 h.
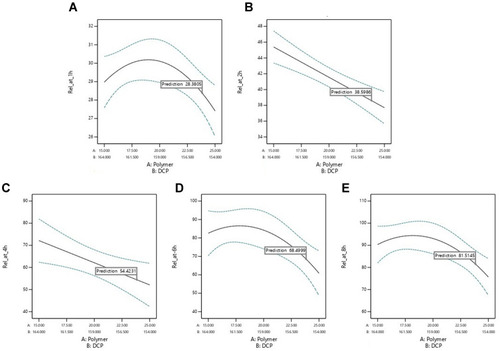
Figure 6 (A) Release profile of validated formulation (B) In-vitro drug release of fixed dose tablet of AML-B and SIM.
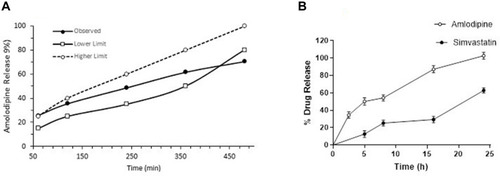
Table 11 Percentage Recovery, Intraday and Inter-Day Accuracy, Precision of AML-B and SIM
Figure 7 Plasma concentration vs time of FDC AML-B (5 mg) and SIM (10 mg) after a single oral administration in dogs (n=6).
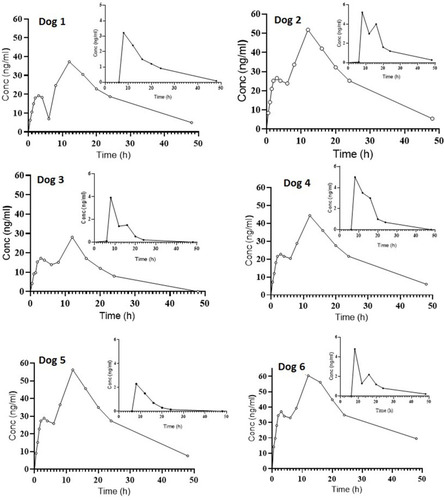
Figure 8 Mean plasma concentration vs time of fixed dose combination AML-B (5 mg) and SIM (10 mg) after a single oral administration in dogs (n = 6).
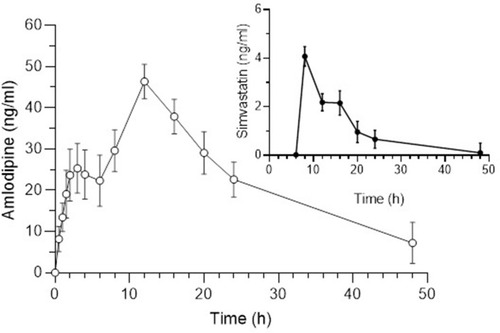
Table 12 Pharmacokinetic Parameters of AML-B and SIM After Oral Administration of Fixed Dose