Figures & data
Figure 1 Synthesis route and 1H NMR spectrum of PLGA conjugated CDDP prodrug (CDDP-PLGA). CDDP-PLGA was synthesized by amidation of the carboxyl groups of CDDP with the amine groups of PLGA.
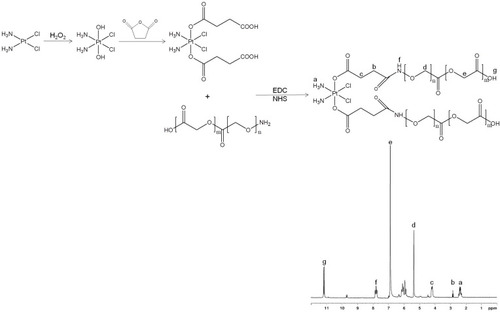
Figure 2 Scheme and TEM image of CDDP-PLGA/CUR LBL NPs. CDDP-PLGA/CUR LBL NPs were prepared by a solvent diffusion technique.
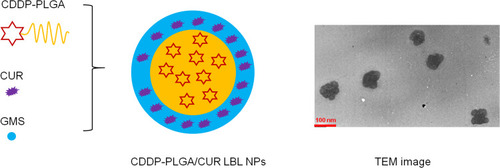
Table 1 Characterization of LBL NPs (Mean ± SD, n=6)
Figure 3 In vitro drug release profiles of CDDP or CUR from LBL NPs. In vitro release of CDDP or CUR from LBL NPs was conducted by dialysis bag diffusion method. Data presented as mean ± SD, n = 3.
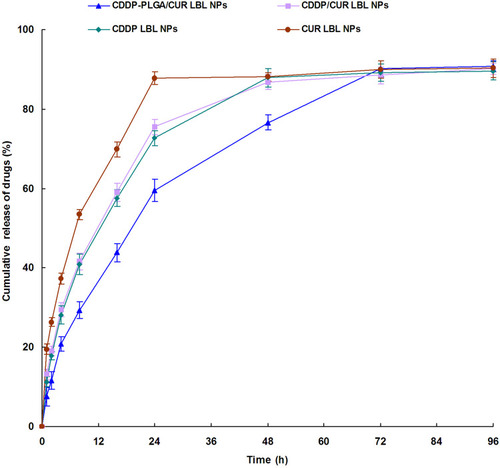
Figure 4 The viability of A549 cells (A), NCI-H1299 cells (B), and BEAS-2B cells (C) when incubated with CDDP-PLGA/CUR LBL NPs, CDDP/CUR LBL NPs, CDDP LBL NPs, CUR LBL NPs, LBL NPs, free CDDP/CUR, free CDDP and free CUR in different concentrations for 72 h. In vitro cytotoxicity of LBL NPs on A549 cells was assessed by the MTT assay. Data presented as mean ± SD, n = 6. *means P < 0.05.
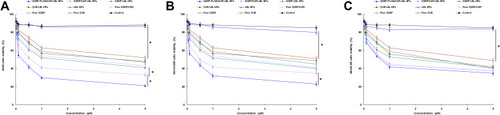
Table 2 The Uptake Efficiency of LBL NPs (Mean ± SD, n=6)
Figure 5 Cellular uptake efficiency of LBL NPs presented by the fluorescent images (A) and flow cytometry (B). Cou-6 was used as a fluorescent probe to determine the cellular uptake efficiency of LBL NPs. Scale bar: 20 μm. Data presented as mean ± SD, n = 6.
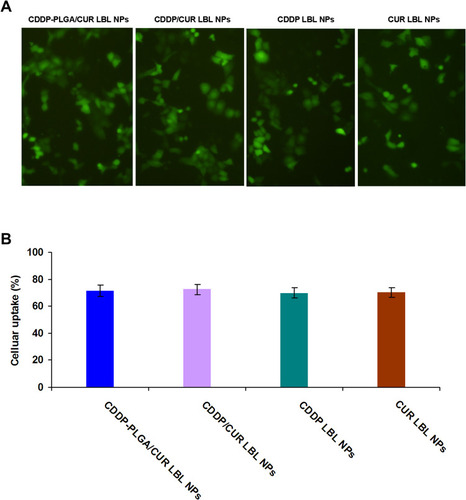
Table 3 Tumor Inhibition Rates (Mean ± SD, n=6)
Figure 6 In vivo anti-tumor efficacy of CDDP-PLGA/CUR LBL NPs evaluated on NSCLC bearing mice, tumor growth (A) and body weight (B) were presented. The tumor volumes were calculated using formulation: V (mm3) = 1/2×(length)×(width)2. After 21 days of injection, mice were sacrificed by cervical decapitation and the final tumor weight and body weight of mice was recorded. Data presented as mean ± SD, n = 6. * means P < 0.05.
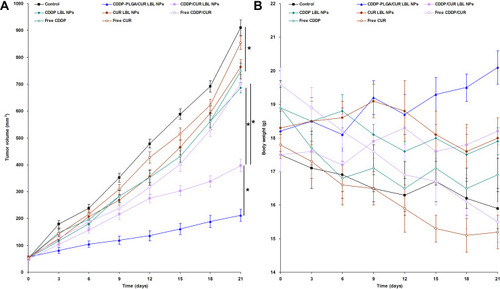
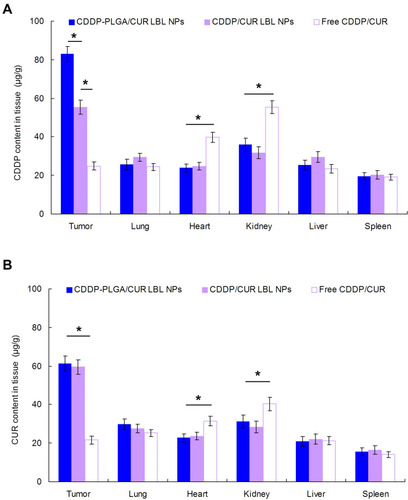
Figure 7 In vivo tissue CDDP (A) and CUR (B) distribution in tissues at 24 h. Mice were sacrificed at 24 h after intravenous injection. The tumor tissue, lung, heart, kidney, liver, and spleen were harvest, decomposed on heating in nitric acid, evaporated to dryness, and redissolved in acetonitrile and water (50/50, v/v) solution. Data presented as mean ± SD, n = 6. * means P < 0.05.