Figures & data
Table 1 Primer Sequences
Table 2 Primary Antibodies
Table 3 Levels of Various Factors
Table 4 Arrangement and Results of Orthogonal Test According to L9 (34)
Figure 1 OMT-LIP characteristics. (A) TEM image of OMT-LIP by negative staining with sodium phosphotungstate solution (50,000×). (B) Particle size of OMT-LIP. (C-D) Particle size of OMT-LIP during storage at 4°C for 7 days and 3 months. (E) In vitro release of OMT-LIP and free OMT in PBS (pH 7.4). Scale bar = 500 nm.
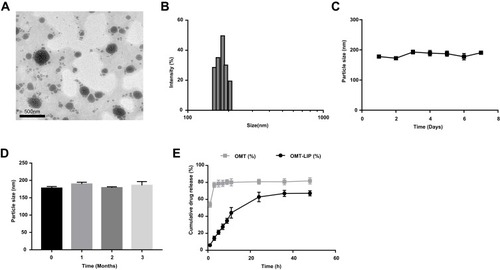
Table 5 Release Kinetic Parameters for OMT from OMT-LIP in PBS (pH 7.4)
Figure 2 Biodistribution of the liposome delivery system was detected by NIRF imaging. The images were obtained after intraperitoneal administration of free DiR or DiR fabricated with LIP at different time intervals (2, 8, 24, and 36 h). (A) Tail images. (B) Whole-body images. (C) Histogram of quantitative analysis of mean fluorescence intensity at the degenerative intervertebral discs. Red arrows indicate puncture sites. **p < 0.01 vs Puncture DiR group, n = 3.
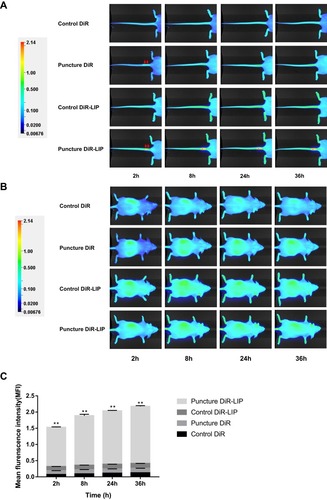
Figure 3 OMT-LIP ameliorated IL-1β-induced apoptosis in NP cells. (A) CCK-8 results of NP cells treated with different concentrations of OMT and OMT-LIP for 48 h. (B) Representative images for nuclei staining with Hoechst 33258 of NP cells observed by fluorescence microscope. (C) NP cell apoptosis was evaluated by flow cytometric analysis after Annexin-V/PI double staining. (D) Quantitative analysis of apoptosis by flow cytometry. Scale bar = 200 μm. **p < 0.01 vs Control group, n = 5; #p < 0.05 vs IL-1β group, n = 5.
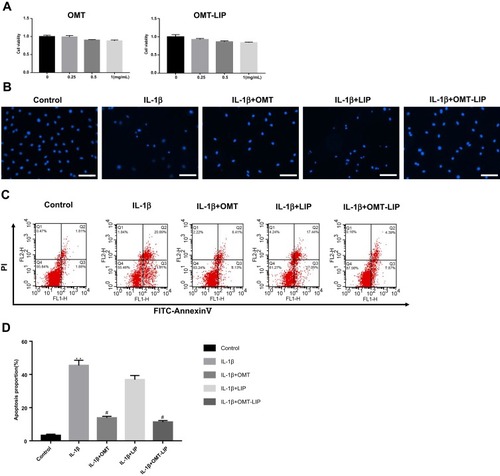
Figure 4 OMT-LIP inhibited MMP3/9, IL-6, and Col2 expression at mRNA and protein levels. (A) Western blot results for MMP3/9, IL-6, and Col2. (B) Band densitometric analysis. (C) mRNA levels of MMP3/9, IL-6, and Col2 as determined by RT-qPCR. The values are presented as mean ± SD. *p < 0.05, **p < 0.01 vs Control group, n = 6; #p < 0.05, ##p < 0.01 vs IL-1β group, n = 6.
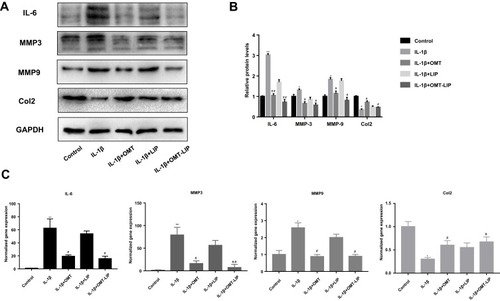
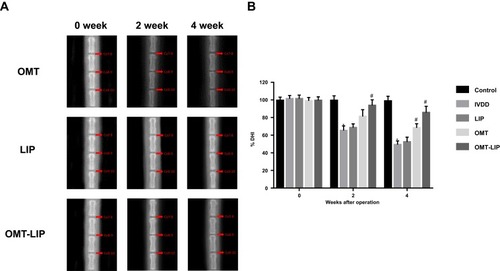
Figure 5 X-ray radiological analysis manifested OMT-LIP could alleviate IVDD in vivo. (A) X-ray results of 0, 2 and 4 weeks after disc puncture surgery. (B) The sequential changes of DHI at 0, 2 and 4 weeks after disc puncture surgery. *p < 0.05 vs Control group, n = 5; #p < 0.05 vs IVDD group, n = 5.