Figures & data
Figure 1 Cell viability of MDA-MB-231 cells following treatment with (A) acetylsalicylic acid (ASA), (B) oseltamivir phosphate (OP), and (C) metformin (Met) using the WST-1 cell proliferation assay. MDA-MB-231 cells were plated at 10,000 cells/mL per well in triplicates. The indicated drug concentrations were serially diluted, and the cells were exposed to the treatments for 24, 48, and 72 hours. At the end of each time point, the WST-1 reagent was added to each well. The cells were incubated for 1.5 hours, after which the plates were read on a colorimetric plate reader. The data are cell viability as a mean percent of control ± S.E.M. of three independent experiments performed in triplicates. The cell viabilities were compared to the untreated control for each time point by ANOVA using the uncorrected Fisher’s LSD multiple comparisons test with 95% confidence with indicated asterisks for statistical significance. *p ≤ 0.05, **p ≤ 0.01, ***p ≤ 0.001, ****p ≤ 0.0001, n = 3.
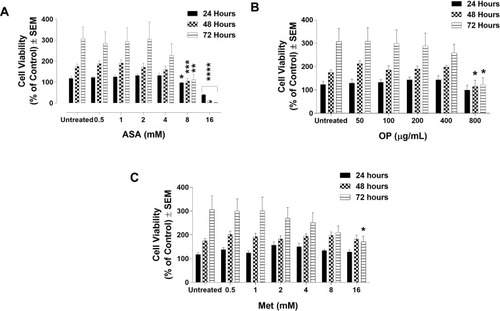
Figure 2 Effect of acetylsalicylic acid (ASA), oseltamivir phosphate (OP), and metformin (Met) on MDA-MB-231 multicellular tumour spheroid (MCTS) volume and viability for 72 hours. Cells were grown in culture media containing 50 μM cyclo-RGDfK(TPP) peptide for 4 days in forming MCTS at which time they were treated with (A) ASA, (B) OP, (C) Met, and (D) ASA plus 300 µg/mL OP and 4 mM Met, at their indicated concentrations. On Day 7, MCTS volumes were measured using V = (4/3) πr3, where π = 3.1415, r = average radius (μm). The images were taken with a 4× objective, and the radius was measured using the scale bar in the phase-contrast image. Percent decrease in MCTS volumes was calculated compared to the untreated control. MCTS viability was assessed after 72 hrs of drug treatment using the WST-1 cell viability assay on day 7. At the end of 72 hrs, the WST-1 reagent was added to each well. The MCTS were incubated for 1 to 3 hours, after which the plates were read on a colorimetric plate reader. The data are MCTS viability as a percent of control ± S.E.M. of two independent experiments performed in triplicates, n = 6. Each bar for the MCTS volume represents n=30–60 spheroids from two replicates of each experiment. The spheroid volumes and viabilities were compared by ANOVA using the Tukey’s multiple comparisons test with 95% confidence with indicated asterisks for statistical significance. * p ≤ 0.05, ** p ≤ 0.01, *** p ≤ 0.001, **** p ≤ 0.0001.
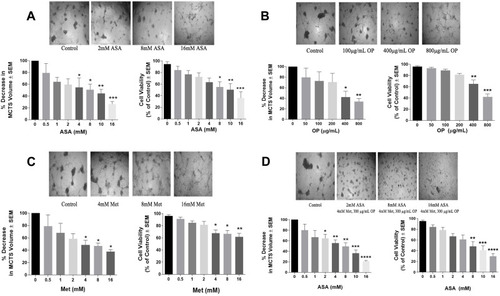
Figure 3 Cell viability of MDA-MB-231 cells treated with tamoxifen (Tmx) in combination with the drug cocktail of ASA, Met, and OP using the WST-1 cell proliferation assay. MDA-MB-231 cells were plated at 10,000 cells/mL in triplicates. The Tmx alone (A) or (B) in combination with drug cocktail containing ASA (8 mM), Met (4 mM), and OP (300 µg/mL) was serially diluted at the indicated concentrations, and the cells were exposed to the treatments for 24, 48, and 72 hours. At the end of each time point, the WST-1 reagent was added to each well. The cells were incubated for 1.5 hours, after which the plates were read on a colorimetric plate reader. The data are cell viability as a mean percent of control ± S.E.M. of three independent experiments performed in triplicates. The cell viabilities were compared to the untreated control for each time point by ANOVA using the uncorrected Fisher’s LSD multiple comparisons test with 95% confidence with indicated asterisks for statistical significance. *p ≤ 0.05, **p ≤ 0.01, ***p ≤ 0.001, ****p ≤ 0.0001, n = 3.
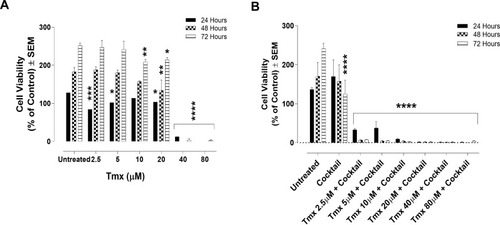
Figure 4 Cell viability of tamoxifen (Tmx) resistant MDA-MB-231-TmxR cells following treatment with (A) acetylsalicylic acid (ASA), (B) oseltamivir phosphate (OP), and (C) metformin (Met) using the WST-1 cell proliferation assay. MDA-MB-231-TmxR cells were plated at a density of 10,000 cells/mL in triplicates. The indicated drug concentrations were serially diluted, and the cells were exposed to the treatments for 24, 48, and 72 hours. At the end of each time point, the WST-1 reagent was added to each well. The cells were incubated for 1.5 hours, after which the plates were read on a colorimetric plate reader. The data are cell viability as a mean percent of control ± S.E.M. of three independent experiments performed in triplicates. The cell viabilities were compared to the untreated control for each time point by ANOVA using the uncorrected Fisher’s LSD multiple comparisons test with 95% confidence with indicated asterisks for statistical significance. *p ≤ 0.05, **p ≤ 0.01, ***p ≤ 0.001, ****p ≤ 0.0001, n = 3.
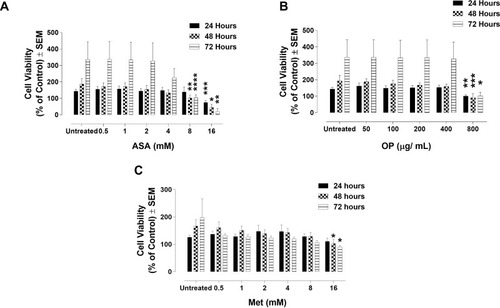
Figure 5 Cell viability of MDA-MB-231-TmxR cells treated with tamoxifen (Tmx) in combination with the drug cocktail of ASA, Met, and OP using the WST-1 cell proliferation assay. MDA-MB-231-TmxR cells were plated at a cell density of 10,000 cells/mL per well in triplicates. The Tmx alone (A) or (B) Tmx in combination with a drug cocktail containing ASA (8 mM), Met (4 mM), and OP (300 µg/mL) was serially diluted at the indicated concentrations. The cells were exposed to the treatments for 24, 48, and 72 hours. At the end of each time point, the WST-1 reagent was added to each well. The cells were incubated for 1.5 hours, after which the plates were read on a colorimetric plate reader. The presented data are cell viability as a percent of control ± S.E.M. of three independent experiments performed in triplicates. The cell viabilities were compared to the untreated control for each time point by ANOVA using the uncorrected Fisher’s LSD multiple comparisons test with 95% confidence with indicated asterisks for statistical significance. *p ≤ 0.05, **p ≤ 0.01, n = 3.
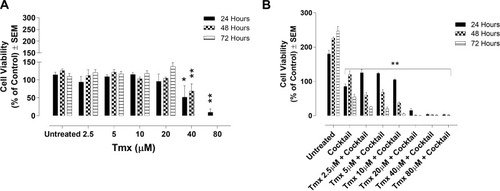
Figure 6 Cell viability of tamoxifen (Tmx) resistant MDA-MB-231-TmxR tumour MCTS following treatment with Tmx in a dose-response or in combination with (A) acetylsalicylic acid (ASA), (B) oseltamivir phosphate (OP), (C) metformin (Met) and (D) cocktail of ASA, OP, and Met using the WST-1 cell proliferation assay. The cell viability of MDA-MB-231-TmxR MCTS with increasing Tmx concentrations in the presence or absence of 8 mM ASA (A), 300 µg/mL OP (B), 4mM Met (C), and a cocktail of 8 mM ASA, 300 µg/mL OP, and 4 mM Met (D). The IC50 values represent the individual drug concentration to inhibit 50% of the cell viability. The half-maximal inhibitory concentration (IC50) was calculated using logarithmic regression with GraphPad Prism. The data are representative of two replicates of two independent experiments performed in triplicate with n=30–60 MCTS analyzed at each Tmx concentrations. Unpaired t-test was used to determine significant differences in cell viability between MDA-MB-231-TmxR MCTS with Tmx alone or in combination with ASA, OP, and Met at each Tmx concentration with asterisks for statistical significance *p ≤ 0.05, **p ≤ 0.001.
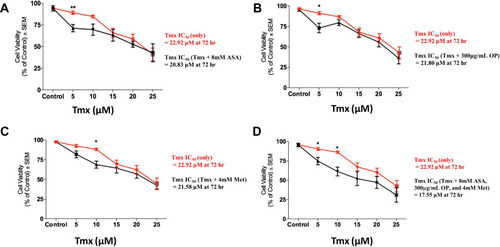
Figure 7 Viability, early apoptosis and necrosis of MDA-MB-231 cells 48 hours after treatment with Tmx (20μM), cocktail (ASA 8mM, Met 4mM, OP 300μg/mL) and combination (Tmx plus cocktail) using the Annexin V-FITC apoptosis and propidium iodide assay. (A) 100,000 cells were collected and stained with Annexin V-FITC/Propidium Iodide to assess early apoptosis and necrosis. (B) Comparisons were made within treatment groups to assess the shift of percent of cells that are viable, early apoptotic and necrotic stages of cell death following 48 hours of indicated treatments. (C) Comparisons were made between untreated cohorts and treatment groups for percent viable, early apoptotic, and necrotic cells. The data are cell viability as a percent of control ± S.E.M. of two independent experiments performed. The cell viabilities were compared to the untreated control for each treatment by ANOVA using the uncorrected Fisher’s LSD multiple comparisons test with 95% confidence with indicated asterisks for statistical significance. *p ≤ 0.05, ***p ≤ 0.001, n = 2.
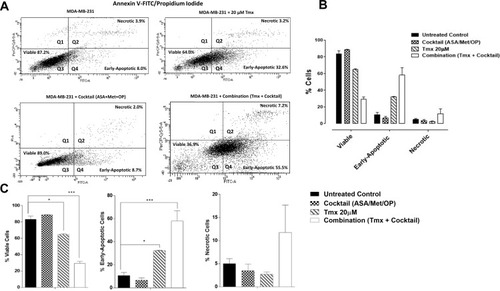
Figure 8 Viability, early apoptosis and necrosis of tamoxifen (Tmx) resistant MDA-MB-231-TmxR cells 48 hours after treatment with Tmx (23μM), cocktail (ASA 8mM, Met 4mM, OP 300μg/mL) and combination (Tmx plus cocktail) using the Annexin V-FITC apoptosis and propidium iodide assay. (A) 100,000 cells were collected and stained with Annexin V-FITC/Propidium Iodide to assess early apoptosis and necrosis. (B) Comparisons were made within treatment groups to assess the shift of percent of cells that are viable, early apoptotic and necrotic stages of cell death following 48 hours of indicated treatments. (C) Comparisons were made between untreated cohorts and treatment groups for percent viable, early apoptotic, and necrotic cells. The presented data are cell viability as a percent of control ± S.E.M. of two independent experiments. The cell viabilities were compared to the untreated control for treatments by ANOVA using the uncorrected Fisher’s LSD multiple comparisons test with 95% confidence with indicated asterisks for statistical significance. *p ≤ 0.05, n = 2.
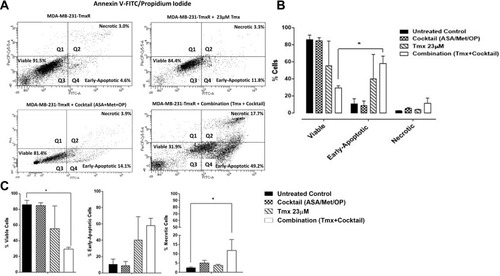
Figure 9 Tube formation assay of HuVEC cells 10 hours after treatment with tamoxifen (Tmx 20 µM), cocktail (ASA 8 mM, Met 4 mM OP 300 μg/mL) and Tmx plus cocktail. (A) HuVECs were plated at 10,000 cells/well on 50 μL of Matrigel followed by treatment with Tmx (20 μM), cocktail, Tmx plus the cocktail or left untreated. Phase-contrast images were acquired by the Incucyte Zoom Imager every 2 hours at 10x magnification. Scale bar represents 300 μm. (B) Analyses of tube formation were done with ImageJ Software using the Angiogenesis Analyzer Plugin. The number of nodes, mean mesh size and the number of isolated segments were analyzed for each treatment condition. The data are mean ± SEM of two independent experiments.
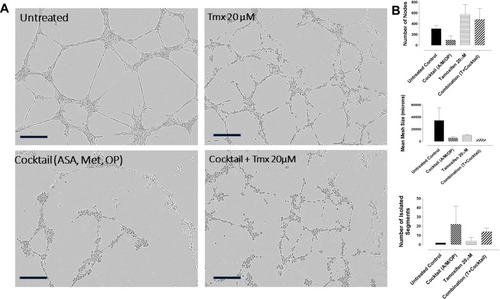
Figure 10 CellEvent Caspase 3/7 Green Assay of HuVEC cells at 0, 24, 48, and 72 hours after treatment with a cocktail (ASA 8 mM, Met 4 mM, OP 300 μg/mL), tamoxifen (Tmx 20 µM), Tmx 20 µM + Cocktail, or left untreated. (A) HuVECs were plated at 10,000 cells/well. Cells adhered to the well were treated with Tmx (20 μM), cocktail (OP 300 μg/mL, Met 4 mM, ASA 8 mM), and Tmx 20 μM plus the cocktail or left untreated. CellEvent™ Caspase 3/7 Green Detection Reagent was added at a concentration of 5 μM in human endothelial cell media. Green fluorescent images were acquired by the Incucyte Zoom Imager every 2 hours at 10x magnification. Scale bar represents 300 μm. (B) Analyses were done using the Incucyte Zoom Imager Software Analyzer to count the number of expressing Caspase 3/7 (green) cells. The images are representative of two independent experiments showing similar results. The graph represents the mean ± SEM combined results from two independent experiments compared to the untreated control for each treatment by ANOVA using the uncorrected Fisher’s LSD multiple comparisons test with 95% confidence with indicated asterisks for statistical significance. ns, not significant, *p ≤ 0.01, **p ≤ 0.001, n = 2.
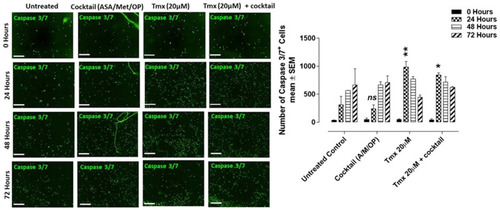
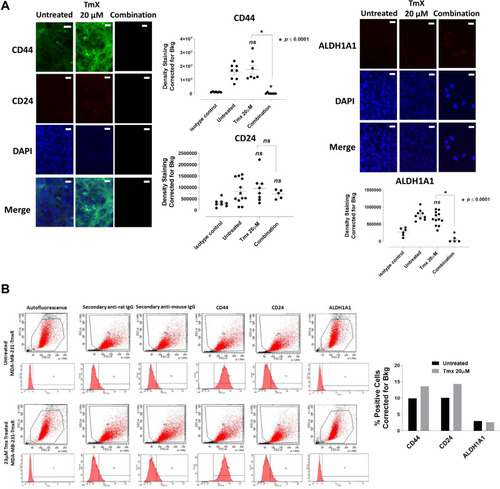
Figure 11 Analyses of MDA-MB-231 cells for CD44, CD24 and ALDH1A1 stem-like markers following 72-hour exposure to Tmx, ASA, Met, OP and Tmx in a combination of ASA, Met and OP cocktail using immunocytochemistry and flow cytometry. (A) MDA-MB-231 cells were plated at 150,000 cells/mL and left untreated, treated with Tmx (20 μM), ASA (8 mM), Met (4 mM), OP (300 μg/mL) and Tmx (20 μM) in combination with ASA, Met and OP for 72 hours. Cells were immunostained for markers of CD44, CD24 and ALDH1A1. The results are depicted as a scatter plot of data visualization using dots to represent the indicated marker values obtained from 2 independent experiments of multiple images (n = 4–12). The mean density staining corrected for background (Bkg) ± S.E.M. for indicated marker values is indicated for each group. The density staining values of each group were compared to the untreated control as well as Tmx in combination with drug cocktail with Tmx alone by ANOVA using the uncorrected Fisher’s LSD multiple comparisons test with 95% confidence with indicated asterisks for statistical significance. (B) Flow cytometry of untreated and Tmx (20µM) treated MDA-MB-231 cells for 72 hrs. One million cells were immunostained for CD44, CD24, and ALDH1A1. Data are presented as the percentage of cells expressing the markers corrected for background autofluorescence. ns, not significant, *p ≤ 0.01, **p ≤ 0.001, ***p ≤ 0.0001. P1, all viable cells; P2, antibody of interest.
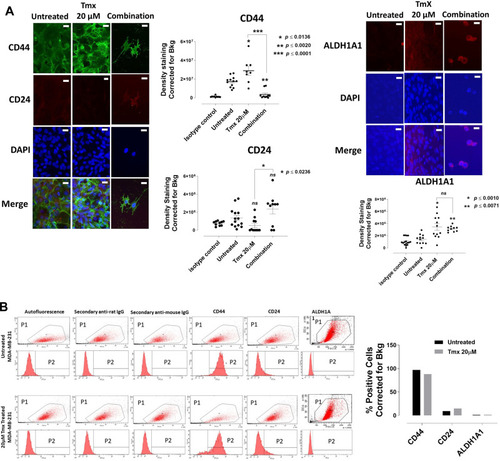
Table 1 The Ratio of CD44/CD24 Expression on MDA-MB-231 and MDA-MB-2321-TmxR Cells After Treatment with Tmx, ASA, Met, OP Alone and Tmx in Combination with ASA, Met and OP
Figure 12 Analyses of MDA-MB-231-TmxR cells for CD44, CD24 and ALDH1A1 stem-like markers following 72-hour exposure to Tmx, ASA, Met, OP and Tmx in a combination of ASA, Met and OP cocktail using immunocytochemistry and flow cytometry. (A) MDA-MB-231-TmxR cells were plated at 150,000 cells/mL and left untreated, treated with Tmx (20 μM), ASA (8 mM), Met (4 mM), OP (300 μg/mL) and Tmx (20 μM) in combination with ASA, Met and OP for 72 hours. Cells were immunostained for markers of CD44, CD24 and ALDH1A1. The results are depicted as a scatter plot of data visualization using dots to represent the indicated marker values obtained from 2 independent experiments of multiple images (n = 4–12). The mean density staining corrected for background (Bkg) ± S.E.M. for indicated marker values is indicated for each group. The density staining values of each group were compared to the untreated control as well as Tmx in combination with drug cocktail with Tmx alone by ANOVA using the uncorrected Fisher’s LSD multiple comparisons test with 95% confidence with indicated asterisks for statistical significance. (B) Flow cytometry of untreated and Tmx (20 µM) treated MDA-MB-231-TmxR cells for 72 hrs. One million cells were immunostained for CD44, CD24, and ALDH1A1. Data are presented as the percentage of cells expressing the markers corrected for background autofluorescence. ns, not significant, *p ≤ 0.0001, P1, all viable cells; P2, antibody of interest.