Figures & data
Figure 1 Expression of PPARγ in pancreatic cancer tissues and para-carcinoma tissues. Surgically resected human pancreatic adenocarcinomas were obtained, and the expression of PPARγ in (A) pancreatic cancer tissues and (B) para-carcinoma tissues was examined by immunohistochemistry. (C) Scoring for PPARγ expression in each section according to the degree of staining and the percentage of stained cells (n=18, *P < 0.01).
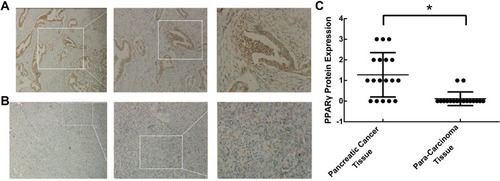
Figure 2 Rosiglitazone inhibited the viability of pancreatic cancer cells. (A) PANC1 and (B) PaTu8988 cells were treated with DMSO or 40 µM rosiglitazone in combination with 0 or 4 Gy irradiation for 48 hrs; 40µM rosiglitazone plus 4 Gy irradiation inhibited cell viability significantly compared with either rosiglitazone or radiation treatment alone. Data are presented as the mean ± SEM for triplicate experiments. Statistical analysis between the groups was determined by ANOVA; *P < 0.05, **P < 0.01.
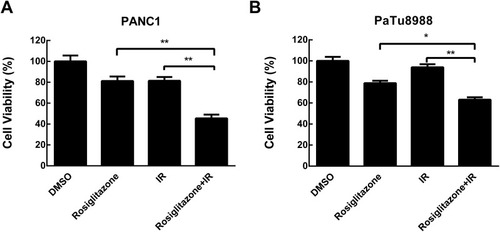
Figure 3 Rosiglitazone plus radiation suppressed the migration and invasion of pancreatic cancer cells. Rosiglitazone and radiation suppressed the migration and invasion of pancreatic cancer cells. Scratch-wound assay was performed, and wound healing was observed with a microscope 24 hrs later. (A and B), representative images in PANC1 and PaTu8988 cells, respectively. Transwell migration assays for (C, E) PANC1 and (D, F) PaTu8988 cells were performed in Matrigel invasion chambers, and cells were allowed to migrate through the Matrigel. Migrated cells were stained by crystal violet and counted to plot. The data are shown as the mean ± SEM for three independent experiments (*P < 0.05, **P < 0.01).
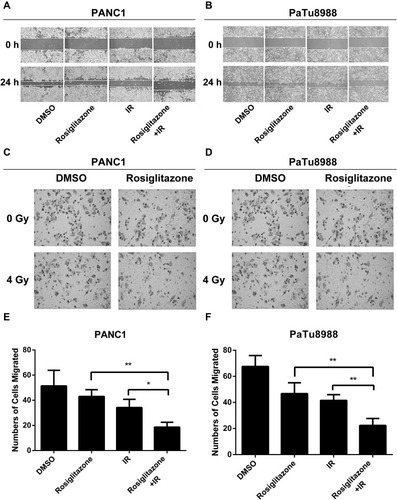
Figure 4 Rosiglitazone enhanced the radiation sensitivity of pancreatic cancer cells. (A and B) Clonogenic cell survival curves and main parameters were generated for PANC1 and PaTu8988 cells, respectively. Cells were treated with 40 µM rosiglitazone or DMSO prior to 2, 4, 6 or 8 Gy radiation exposure. The survival fractions were normalized to the unirradiated control group. The radiation sensitivity enhancement ratio (SER) was measured according to the multi-target, single-hit model. D0, Dq and the calculated SER values of the control and rosiglitazone groups are shown.
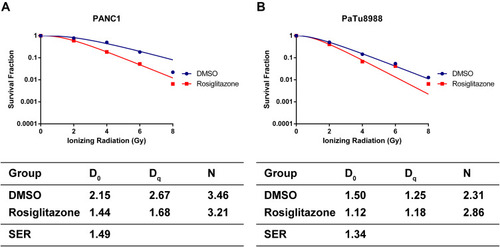
Table 1 Micorarray Analysis of Gene Expression Changes Between Radiation and Rosiglitazone Plus Radiation in PANC1 Cells (Top 30)
Figure 5 Differentially expressed genes involved in rosiglitazone-mediated radiosensitization in PANC1 cells. PANC1 cells were treated with DMSO (as control) or rosiglitazone prior to 4 Gy irradiation. (A) Heatmap of gene expression in PANC1 cells between control group and rosiglitazone-treated group. (B) Heatmap of gene expression (top 30) in PANC1 cells. The left half shows the downregulated mRNA, and right half shows the upregulated mRNA. (C, E and G) Gene Ontology (GO) annotation for upregulated genes based on molecular function, biological process and cellular component, respectively. (D, F and H) GO annotation for downregulated genes based on molecular function, biological process and cellular component, respectively.
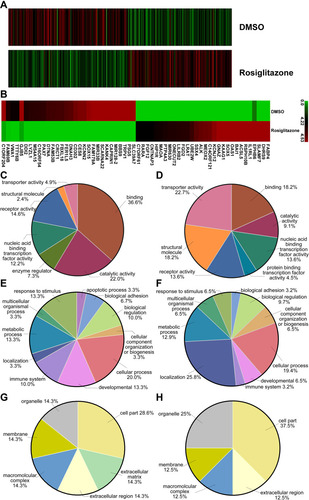
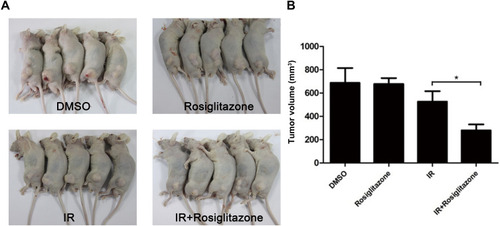
Figure 6 Rosiglitazone enhanced the radiation sensitivity of PANC1 xenografts. Each group of mice was composed of five male nude mice. PANC1 cells were inoculated under the skin of nude mice. (A) Representative xenografts from each group. (B) Tumor size was measured on the 21st day after the first inoculation. Data are presented as the mean ± SEM. * P < 0.05, compared with radiation alone group.