Figures & data
Table 1 Demographics and Other Baseline Characteristics
Table 2 Adverse Events
Figure 1 Development of RCCEP in a breast cancer patient treated with 1 mg/kg of camrelizumab. (A, B) The initial RCCEP lesion was observed at approximately 2 weeks after the first dose of study drug on the lateral chest followed by lesions on the anterior chest. (C–E) Since this patient showed stable disease (SD) at Day 56 and subsequently a partial response (PR) at Day 112, she continued to receive camrelizumab and additional RCCEP appeared on her upper trunk and neck. (F–H) After interrupting camrelizumab treatment for 28 days in response to cellulitis requiring hospitalization, there was substantial regression of the RCCEP. (I) Upon re-starting camrelizumab, one of the previous RCCEP lesions re-grew without progression of RCCEP lesions elsewhere. Blue solid arrow represents treatment time, while hatched blue color represents the treatment pause. Black arrows connect the timing of RCCEP photographs and the treatment timeline.
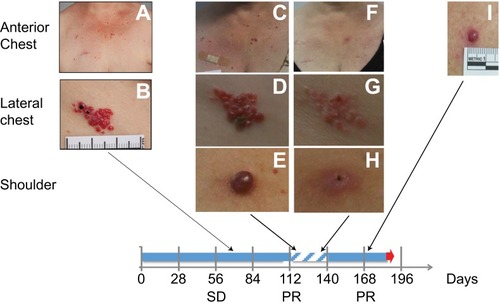
Figure 2 Serum camrelizumab concentration–time curve and receptor occupancy (RO). (A, B) Serum camrelizumab concentration–time curve after single IV infusion in linear (A) and semi-logarithmic (B) scale during the first 28 days after the initial infusion. (C, D) Camrelizumab RO on CD4+ (C) and CD8+ (D) T Cells at the 10 mg/kg dose level and 200 mg flat dose level for the entire treatment period. Blood samples were obtained at the time points shown out to 28 days after the first dose and then prior to the second and subsequent dose (every 28 days). Each line represents an individual patient, with red lines indicating 10 mg/kg treated patients and blue lines indicating 200 mg flat dosing.
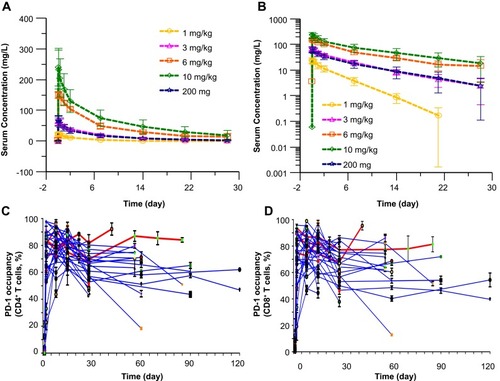
Table 3 Response and Survival Data
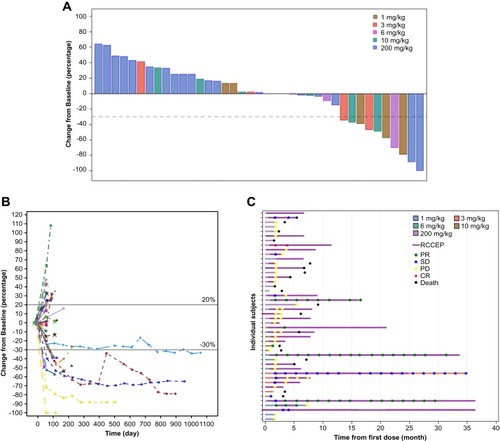
Figure 3 Clinical response. (A) Waterfall plot of the maximal percentage reduction from baseline of the sum of longest diameters of target lesions for both dose-escalation and expansion phases. (B) Spider plot of the percentage change from baseline in the sum of longest diameters of target lesions over time. (C) Duration of treatment (n=46). Each individual patient treatment time is plotted from time of first dose (x-axis) based on the dose level and dose regimen. Patients with partial responses (green square), stable disease (blue star), progressive disease (yellow star), complete response (red triangle) and death (black circle) are shown along with the start of RCCEP.