Figures & data
Point your SmartPhone at the code above. If you have a QR code reader the video abstract will appear. Or use:

Figure 1 Scheme of study showing five stages of compression: Mix, GS-1, GS-2, F-mix and compression and structure of ANN applied using quick propagation method for data learning algorithm.
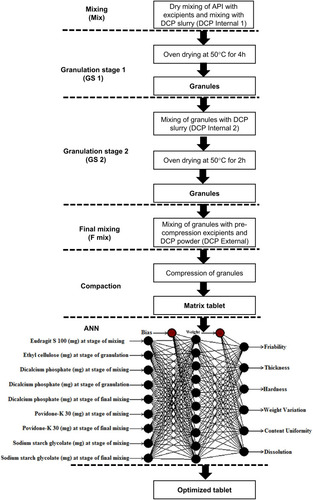
Table 1 Mesalamine Formulations by Wet Granulation Method
Table 2 Physicochemical Characteristics of Mesalamine Formulations (Mean ± S.D)
Figure 2 Percentage release studies of mesalamine from formulation F1-F11 using 0.2 M HCl for 2 h at pH 1.2 and 0.2 M phosphate buffer at pH 7.2 for further 6 h.
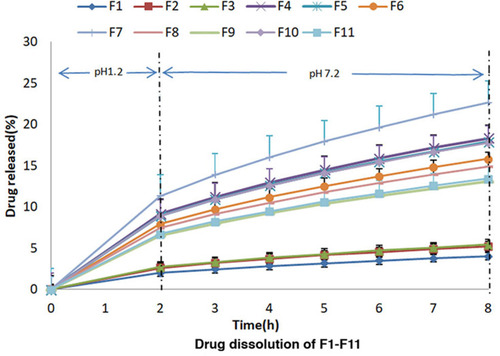
Figure 3 Percentage release studies of mesalamine from formulation F12-F22 using 0.2 M HCl for 2 h at pH 1.2 and 0.2 M phosphate buffer at pH 7.2 for further 6 h.
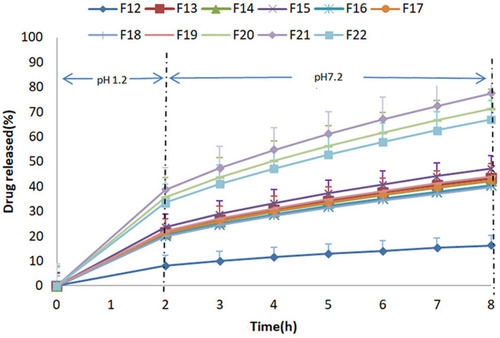
Table 3 Dissolution Kinetic Modeling of All Selected Formulations
Table 4 Optimized Formulations Predicted by ANN
Figure 4 Comparative % release studies of mesalamine from formulation F23-F24 with reference release data using 0.2 M HCl for 2 h at pH 1.2 and 0.2 M phosphate buffer at pH 7.2 for further 10 h.
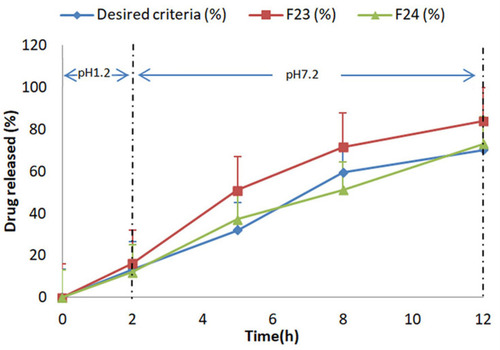
Table 5 Summary of Effect of Ingredients on Parameters
Figure 5 Relative significance of ingredients for the mesalamine colonic system for overall properties of formulation which were ranked as Eudragit-S100> DCP internal 1 used in pre-granulation or Mix stage> DCP internal 2 used in intra-granulation stage or GS-2> DCP external used in F-Mix stage > PVP internal used in extra-granulation stage.
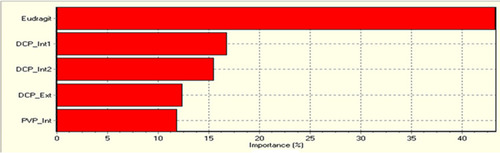
Figure 6 Response surface plots of: (A) hardness: showing that desired hardness of less than 8 kg/cm2 was obtained by varying amount of Eudragit-S100 and DCP-Internal1. (B) Release at 2 h: showing the least effect of Eudragit-S 100 on release at 2 h (C) and (D) release at 3 h and 4 h: showing that Eudragit-S100 and DCP Internal 1 did not impart a significant effect on drug release at 3 h and 4 h. (E) and (F) release at 5 h and 6 h: showing the least effect of DCP-Internal 1 on drug release at 5 h and 6 h. (G, H) Release at 7 h and 8 h: showing the maximum amount of drug was released with the higher amount of Eudragit-S100 and minimum amount of DCP-Internal 1 at 7 h and 8 h.
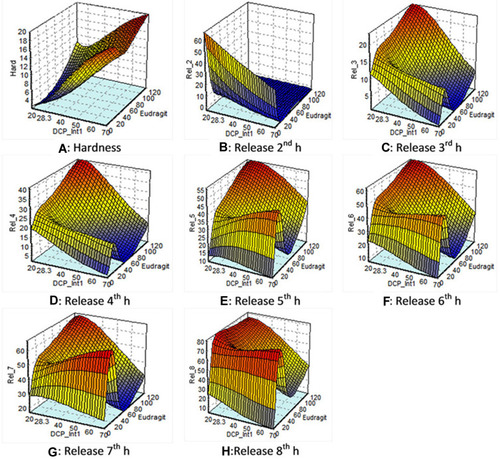
Table 6 Dissolution Profile of Commercially Available Mesalamine, F-23 and F-24
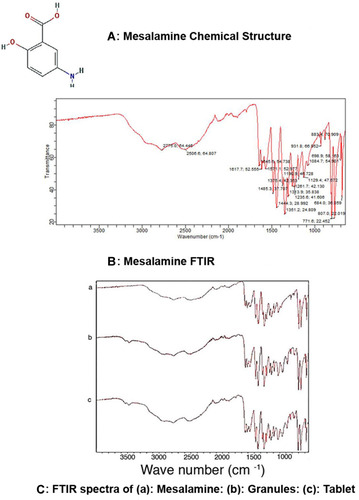
Figure 7 FTIR spectra. (A) Mesalamine chemical structure. (B) Mesalamine FTIR peaks showing the –NH2 functional group bending peak and C=O functional group stretching at 1615–1700 cm−1, along with C-O stretch at 1215 cm−1. (C) FTIR spectra of (a) mesalamine; (b) mesalamine granules; (c) mesalamine tablet showing characteristic peaks of mesalamine functional groups in spectra of mesalamine, mesalamine matrix tablets, and granules with indication of no excipient-drug incompatibility.