Figures & data
Table 1 Primers Used for RT-PCR
Figure 1 Changes in the ECG when the rat I/R model was established.
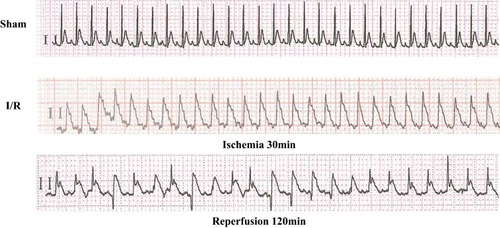
Figure 2 Downregulation of miR-346 in the I/R group. (A) Heat-map of sequencing data of miRNAs. Red and green color represent up- and down-regulation, respectively. (B) and (C) Tables for details of 15 downregulated genes and 29 upregulated genes. (D) RT-PCR assay for the expression of miR-346 (n=6). Note that aP < 0.05 against the Sham group.
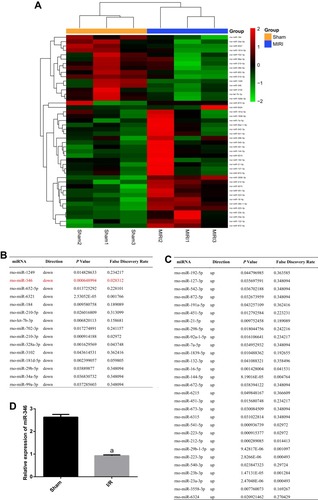
Figure 3 miR-346 directly repressed the expression of Bax gene. (A) Online software TargetScan revealed the predicted binding site of miR-346. (B) Complementary sequence between miR-346 and Bax in human and rat. (C) The effect of miR-346 on the luciferase activity was determined by luciferase reporter assays. miR-346 repressed the transcription of Bax gene. Note that aP < 0.05 against the miR-346+MT group.
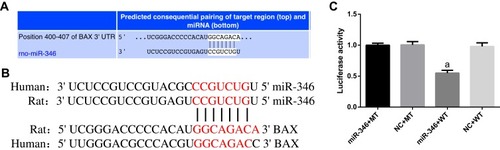
Figure 4 Over-expression of miR-346 can reduce myocardial infarct size. (A) TTC detection of Sham, I/R, AAV-NC, AAV-miR-346 and AAV-miR-346-antago groups. White and gray represent infarct areas and red represents non-infarct areas. (B) Infarct size scores. Note that aP < 0.05 against the Sham group. bP < 0.05 against the I/R group. cP < 0.05 against the I/R or AAV-NC group.
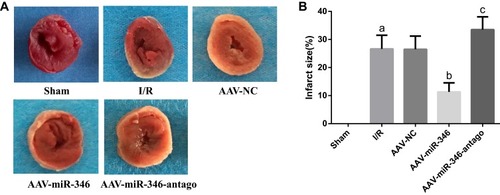
Figure 5 Over-expression of miR-346 attenuates histopathological changes and myocardial damage. (A) HE detection of Sham, I/R, AAV-NC, AAV-miR-346 and AAV-miR-346-antago groups (x200). (B) Myocardial injury scores. (C) Serum myocardial injury marker cTnT levels. Note that aP < 0.05 against the Sham group. bP < 0.05 against the I/R or AAV-NC group.
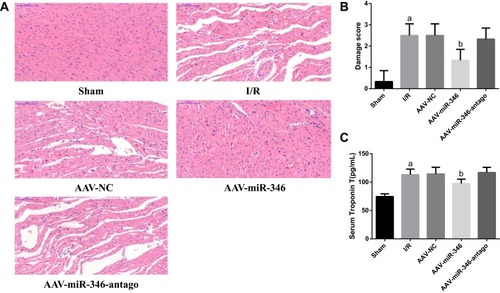
Figure 6 Over-expression of miR-346 inhibited myocardial apoptosis. (A) TUNEL staining for myocardial tissues in Sham, I/R, AAV-NC, AAV-miR-346 and AAV-miR-346-antago groups (x200). The green fluorescence represents the TUNEL-positive cardiomyocyte nucleus, and the blue fluorescence represents the total cardiomyocyte nucleus. (B) The apoptosis index of each group. Note that aP < 0.05 against the Sham group. bP < 0.05 against the I/R or AAV-NC group.
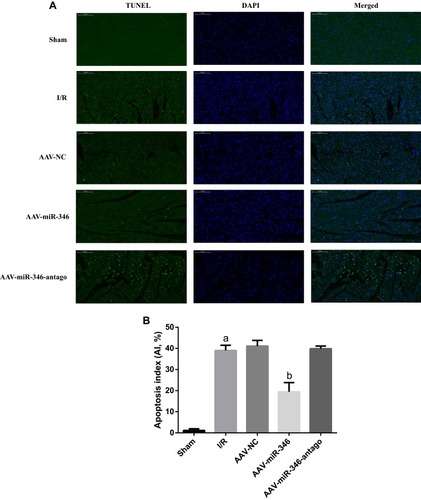
Figure 7 miR-346 inhibited myocardial cell apoptosis mediated by Bax gene. (A) Western blotting was used to detect the expression levels of apoptosis-related proteins in Sham, I/R, AAV-NC, AAV-miR-346 and AAV-miR-346-antago groups and quantitative analyses (B–D). Note that aP < 0.05 against the Sham group. bP < 0.05 against the I/R or AAV-NC group. cP < 0.05 against the I/R group.
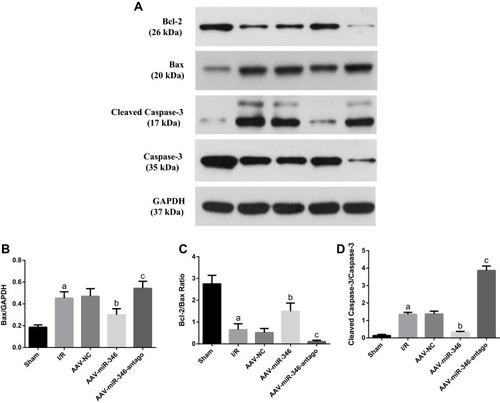
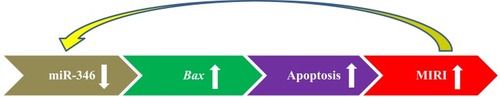
Figure 8 The molecular mechanism diagram showed that miR-346 played an important role in cardiomyocyte apoptosis and the occurrence of MIRI through targeted Bax.