Figures & data
Figure 1 Effect of SA on EB content in brain tissue of SHR rats. (A) Chemical structure of Salvianolic acid A; (B) detection of permeability of BBB by EB. *P<0.05, **P<0.01 and ***P<0.001 versus the SHR group.
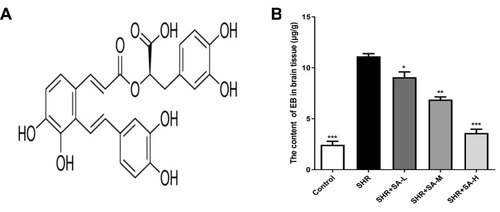
Figure 2 Isolation, cultivation, and identification of pericytes from cerebral microvessels. (A) Isolated microvessels were cultured in the pericyte medium. (B) Pericytes crawled out from the microvessels on Day 3. (C) Pericytes crawled out from the microvessels on Day 7. (D) Pericytes crawled out from the microvessels on Day 14; (E–H) co-expression of PDGFRβ and NG2, as determined by immunofluorescence, identified the isolated cells as pericytes. (E) PDGFRβ-stained pericytes. (F) NG2-stained pericytes. (G) Dapi-stained nucleus. (H) Merged.
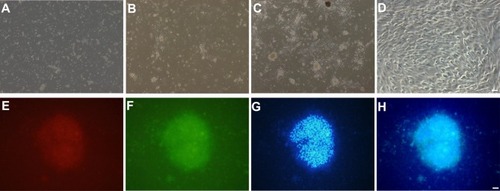
Figure 3 Effect of SA on cell cycle-related protein expression in the pericytes from cerebral microvessels of SHR rats. The rats in the control group were WKY, while SA was injected daily into SHR rats for 4 weeks. The SHR rats were assigned into 4 groups: SHR, SHR+SA-L (2.5 mg/kg SA), SHR+SA-M (5 mg/kg SA), and SHR+SA-H (10 mg/kg SA). (A) Western blot assays for p53, p21, CDK6, cyclin D1, CDK2 and cyclin E proteins in the pericytes. (B) Protein relative levels for p53 and p21. (C) Protein relative levels for CDK6 and cyclin D1. (D) Protein relative levels for CDK2 and cyclin E. *P<0.05, **P<0.01 and ***P<0.001 versus the SHR group.
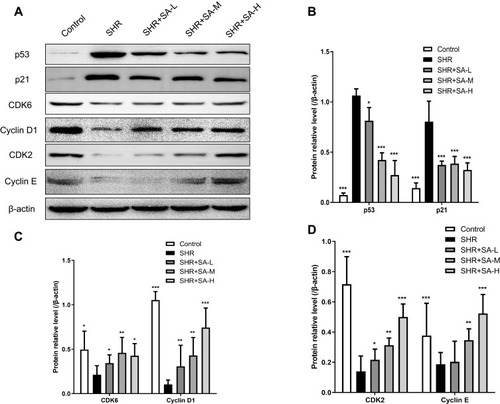
Figure 4 Effect of SA on apoptosis-related protein expression in the pericytes from cerebral microvessels of SHR rats. The rats in the control group were WKY, while SA was injected daily into SHR rats for 4 weeks. The SHR rats were assigned into 4 groups: SHR, SHR+SA-L (2.5 mg/kg SA), SHR+SA-M (5 mg/kg SA), and SHR+SA-H (10 mg/kg SA). (A) Western blot assays for Fas, FasL, cleaved-caspase 3/caspase 3, Bax and Bcl2 proteins in the pericytes. (B) Protein relative levels for Fas and FasL. (C), Protein relative levels for cleaved-caspase 3/caspase 3. (D) Protein relative levels for Bax and Bcl2. E. *P<0.05, **P<0.01 and ***P<0.001 versus the SHR group.
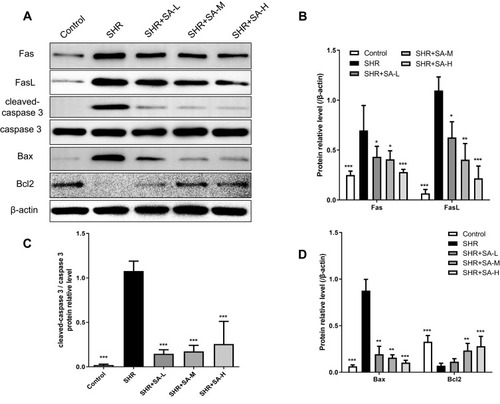
Figure 5 Effect of SA on the Ras/Raf/MEK/ERK pathway in the pericytes from cerebral microvessels of SHR rats. The rats in the control group were WKY, while SA was injected daily into SHR rats for 4 weeks. The SHR rats were assigned into 4 groups: SHR, SHR+SA-L (2.5 mg/kg SA), SHR+SA-M (5 mg/kg SA), and SHR+SA-H (10 mg/kg SA). (A) Western blot assays for Ras, Raf, p-MEK1, p-MEK2, p-ERK1 and p-ERK2 protein in the pericytes. (B) Protein relative levels for Ras and Raf. (C) Protein relative levels for p-MEK1 and p-MEK2. (D) Protein relative levels for p-ERK1 and p-ERK2. *P<0.05, **P<0.01 and ***P<0.001 versus the SHR group.

Figure 6 Effect of SA on Ang2-induced apoptosis in pericytes. (A) 0.01 μM, 0.1 μM, 1 μM and 10 μM Ang2 were separately incubated with the pericytes for 0h, 3h, 6h, 12h and 24h, respectively, and then assayed for cell viability by MTT assay; (B) 1 μM, 5 μM, 10 μM and 20 μM SA were separately incubated with the pericytes for 0h, 3h, 6h, 12h and 24h, respectively, and then assayed for cell viability by MTT assay; (C) the flow cytometry analysis was used for apoptosis detection in pericytes in three experimental groups (WT, Ang2 and Ang2+SA). The pericytes in WT group were inoculated without any intervention (a). In Ang2 group, pericytes were incubated with 1 μM Ang2 for 12h (b). In Ang2+SA group, pericytes were incubated with 20 μM SA for 6h and after that, incubated with 1 μM Ang2 for 12h (c). The statistical analysis of the apoptosis detection (d); (D) Western blot assays for the apoptosis related-proteins expression. Wild-type (WT) refers to the pericytes from cerebral microvessels of normal rats that received no treatment. *P<0.05, **P<0.01 and ***P<0.001 versus 0 h; and ##P<0.01 and ###P<0.001 versus Ang2 group.
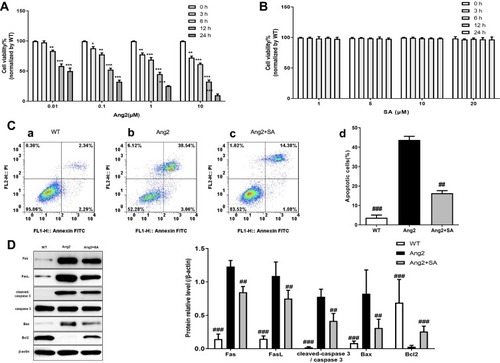
Figure 7 Effect of SA on pericytes cell cycle after Ang2 induction. The pericytes from cerebral microvessels of normal rats. There were three experimental groups (WT, Ang2 and Ang2+SA). (A) Flow cytometry analysis for pericytes cell cycle detection; The pericytes in WT group were inoculated without any intervention (a). In Ang2 group, pericytes were incubated with 1 μM Ang2 for 12h (b). In Ang2+SA group, pericytes were incubated with 20 μM SA for 6h and after that, incubated with 1 μM Ang2 for 12h (c). The statistical analysis of the cell cycle detection (d). (B) Western blot assays for the cell cycle related-proteins expression. ##P<0.01 and ###P<0.001 versus Ang2 group.
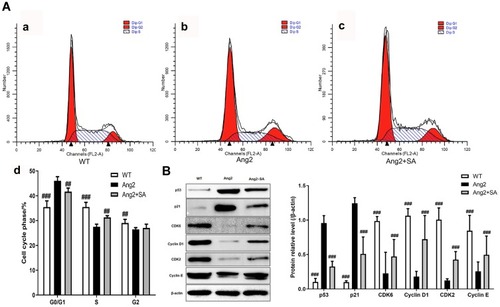
Figure 8 Effect of SA on the expression of Ras/Raf/MEK/ERK pathway proteins in the pericytes after Ang2 induction. The pericytes from cerebral microvessels of normal rats. There were three experimental groups (WT, Ang2 and Ang2+SA). The pericytes in WT group were inoculated without any intervention. In Ang2 group, pericytes were incubated with 1 μM Ang2 for 12h. In Ang2+SA group, pericytes were incubated with 20 μM SA for 6h and after that, incubated with 1 μM Ang2 for 12h. Western blot assays for the expression of Ras, Raf, MEK1, MEK2, ERK1 and ERK2 proteins. Wild type (WT) refers to the pericytes from cerebral microvessels of normal rats that received no treatment. #P<0.05, ##P<0.01 and ###P<0.001 versus Ang2 group.
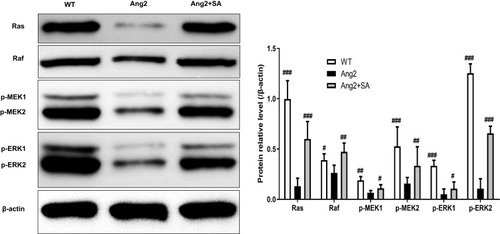
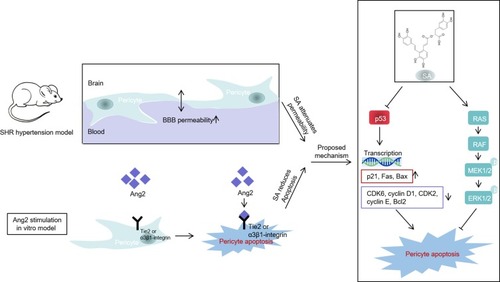
Figure 9 Proposed model for this study. SA ameliorated the permeability of BBB in spontaneously hypertensive rats through the inhibition of apoptosis of pericytes via the p53 and the Ras/Raf/MEK/ERK pathways. SA reduced Ang2-induced apoptosis of cerebral microvessels pericytes by in vitro inhibiting p53 and activating Ras/Raf/MEK/ERK pathway.