Figures & data
Figure 1 RGTZ induces PPAR-γ activation in the kidneys of HN rats. (A) A rat model of HN was established by daily oral administration of a mixture of adenine and potassium oxonate. In some rats, RGTZ was administrated. After 3 weeks, the kidneys were taken for immunoblot analysis for PPAR-γ or glyceraldehyde 3-phosphate dehydrogenase (GAPDH). (B) Expression levels of PPAR-γ were calculated by densitometry, and the ratio between PPAR-γ and GAPDH was determined. (C) Photomicrographs (original magnification, ×400) illustrate immunohistochemical PPAR-γ staining of kidney tissues. RGTZ, rosiglitazone. Data are represented as the mean ± SEM. *p < 0.05 versus sham group; #p < 0.05 versus sham + RGTZ group. **p< 0.05 versus HN group.
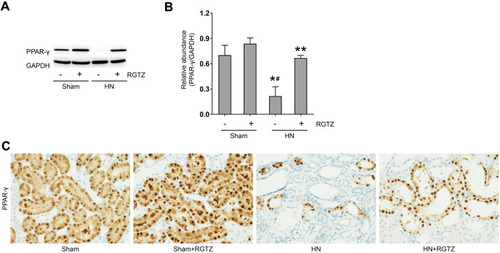
Figure 2 RGTZ improves renal function and alleviates proteinuria and renal damage in HN rats. Levels of (A) serum creatinine, (B) blood urea nitrogen (BUN), and (C) urine microalbumin were examined using biochemical assays. (D) Photomicrographs illustrating hematoxylin–eosin (HE), Masson’s trichrome, and periodic acid-Schiff (PAS) staining of kidney tissue from the different groups (original magnification ×200).(E) Interstitial fibrosis score of kidney tissue from the different groups. RGTZ, rosiglitazone. Data are represented as the mean ± SEM. *p < 0.05 vs sham group; #p< 0.05 vs sham + RGTZ group. **p < 0.05 vs HN group.
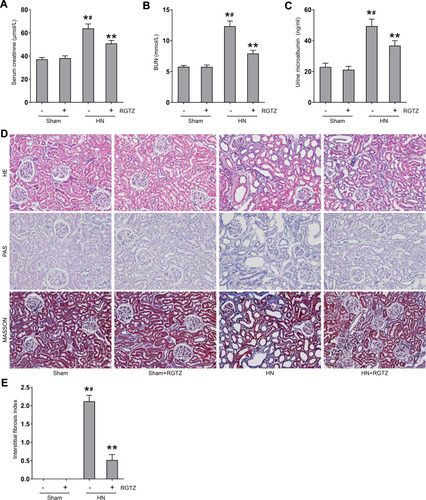
Figure 3 RGTZ decreases fibronectin and collagen I expression in the kidneys of HN rats. (A) Kidney tissue lysates were subjected to immunoblot analysis with specific antibodies against fibronectin, collagen I, or glyceraldehyde 3-phosphate dehydrogenase (GAPDH). (B) Expression levels of fibronectin were quantified by densitometry and normalized to GAPDH. (C) Expression levels of collagen I were quantified by densitometry and normalized to GAPDH. (D) Photomicrographs (original magnification, ×400) illustrate immunohistochemical fibronectin staining of the kidney tissues. RGTZ, rosiglitazone. Data are represented as the mean ± SEM. *p < 0.05 vs sham group; #p < 0.05 vs sham + RGTZ group. **p < 0.05 vs HN group.
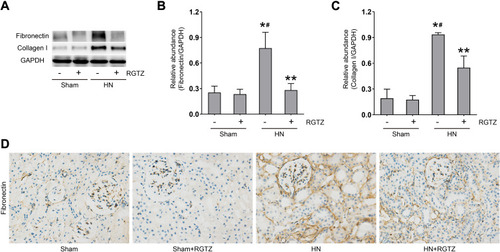
Figure 4 RGTZ abrogates TGF-β-Smad3 signaling in the kidneys of HN rats. (A) Kidney tissue lysates were subjected to immunoblot analysis with specific antibodies against TGF-β1 or glyceraldehyde 3-phosphate dehydrogenase (GAPDH). (B) Expression levels of TGF-β1 were quantified by densitometry and normalized to GAPDH. (C) The kidney tissue lysates were subjected to immunoblot analysis with specific antibodies against p-Smad3, Smad3, or GAPDH. (D) Expression levels of p- Smad3 were quantified by densitometry and normalized to Smad3. RGTZ, rosiglitazone. Data are represented as the mean ± SEM. *p < 0.05 vs sham group; #p< 0.05 vs sham + RGTZ group. **p < 0.05 vs HN group.
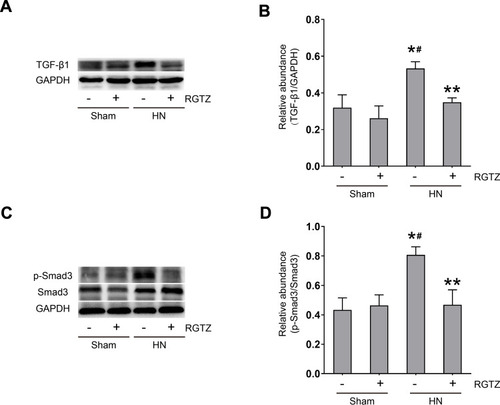
Figure 5 RGTZ inhibits renal tubular epithelial-to-mesenchymal transition in the kidneys of HN rats. (A) Kidney tissue lysates were subjected to immunoblot analysis with specific antibodies against E-cadherin, vimentin, α-SMA, or glyceraldehyde 3- phosphate dehydrogenase (GAPDH). (B) Expression levels of E-cadherin were quantified by densitometry and normalized to GAPDH. (C) Expression levels of vimentin were quantified by densitometry and normalized to GAPDH. (D) Expression levels of α-SMA were quantified by densitometry and normalized to GAPDH. (E) Photomicrographs (original magnification, ×400) illustrate immunohistochemical staining of E-cadherin and α-SMA in the kidney tissues. RGTZ, rosiglitazone. Data are represented as the mean ± SEM. *p < 0.05 vs sham group; #p < 0.05 vs sham + RGTZ group. **p < 0.05 vs HN group.
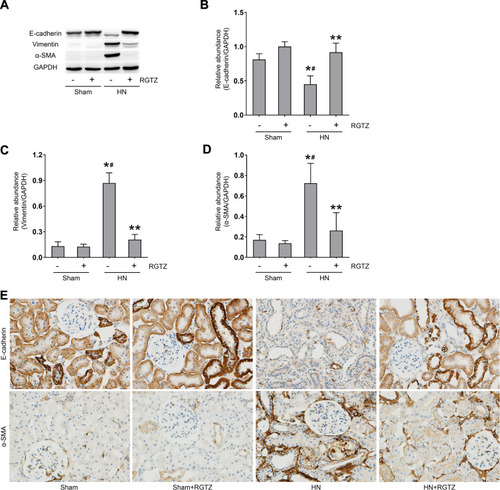
Figure 6 RGTZ mediates NF-κB pathway activation and inhibits macrophage infiltration in the kidneys of HN rats. (A) Kidney tissue lysates were subjected to immunoblot analysis with specific antibodies against p-NF-κB (p65), NF-κB (p65), or glyceraldehyde 3-phosphate dehydrogenase (GAPDH). (B) Expression levels of p-NF- κB (p65) were quantified by densitometry and normalized to NF-κB (p65). (C) Photomicrographs (original magnification, ×400) illustrate immunohistochemical staining for CD68 in kidney tissue. RGTZ, rosiglitazone. Data are represented as the mean ± SEM. *p < 0.05 vs sham group; #p < 0.05 vs sham + RGTZ group. **p < 0.05vs. HN group.
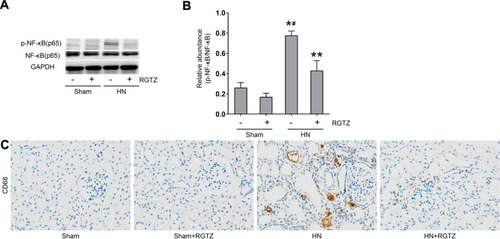
Figure 7 RGTZ inhibits the release of cytokines/chemokines in the kidney of HN rats. Protein was extracted from kidney and subjected to ELISA. Protein expression levels of (A) MCP-1, (B) RANTES, (C) TNF-α, and (D) IL-1β are indicated. RGTZ, rosiglitazone. Data are represented as the mean ± SEM. *p < 0.05 vs sham group; #p< 0.05 vs sham + RGTZ group. **p < 0.05 vs HN group.
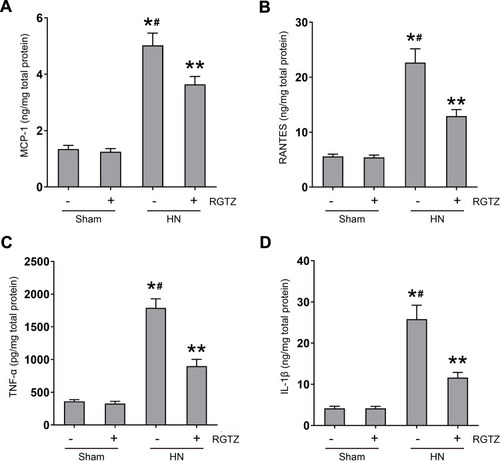
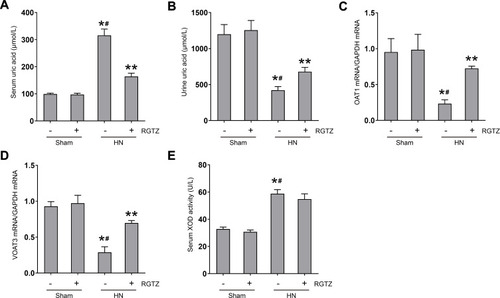
Figure 8 RGTZ decreases serum uric acid and preserves expression of OAT1 and OAT3 in the kidneys of HN rats. Levels of uric acid in the (A) serum and (B) urine were examined using an automatic biochemical assay. (C) OAT1 and (D) OAT3 mRNA expression in renal tissue from the different groups (normalized to GAPDH). (E) Serum XOD activity was examined using a XOD kit. RGTZ, rosiglitazone. Data are represented as the mean ± SEM. *p < 0.05 vs sham group; #p < 0.05 vs sham + RGTZ group. **p < 0.05 vs HN group.