Figures & data
Figure 1 Structure of candesartan.
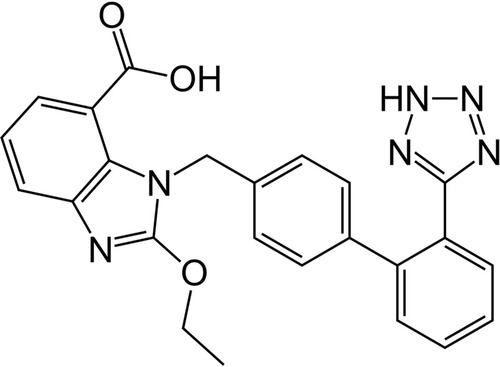
Table 1 Methods and Polymers Used in Preparation of Solid Dispersions, Inclusion Complexes and Nanoparticles of CC
Figure 2 Phase solubility diagram of CC/β-CD and CC/HP-β-CD in water at 250°C.
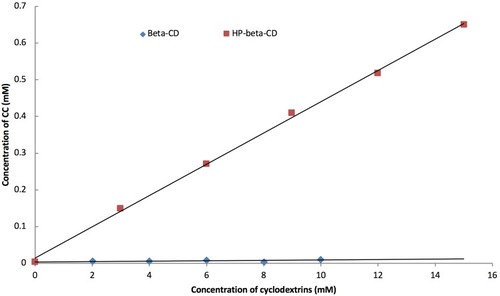
Table 2 Average Particle Size of CC Nanoparticles
Figure 3 Zeta potential (ζ) of the prepared nanoparticles: (A) S1 and (B) S2.
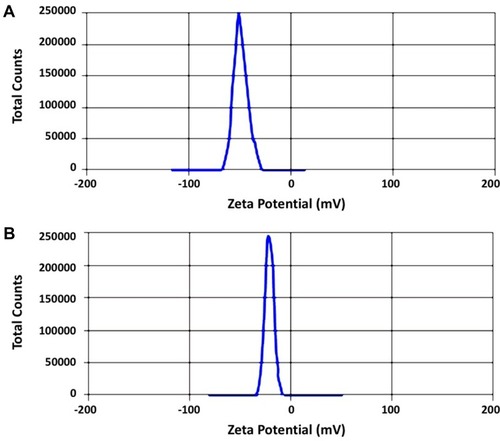
Figure 4 TEM images of the prepared nanoparticles: (A) S1 and (B) S2.
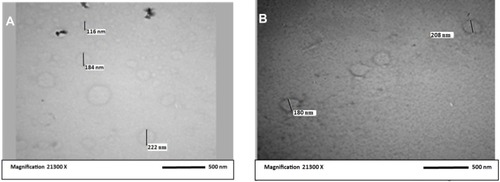
Figure 5 X-ray diffraction patterns of (A) CC, (B) PVP-K90, (C) PM with PVP-K90, (D) SD with PVP-K90, (E) PEG8000, (F) PM with PEG 8000, (G) SD with PEG 8000, (H) HP-β-CD, (I) PM with HP β-CD, (J) IC with HP β-CD, (K) PM with PVP-K30, (L) nano with PVP-K30, (M) PM with PVP-K90, and (N) nanoparticles with PVP-K90.
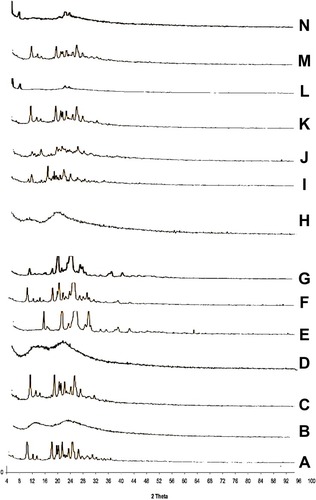
Figure 6 FT-IR of (A) CC, (B) PVP-K90, (C) PM with PVP-K90, (D) SD with PVP-K90, (E) PEG8000, (F) PM with PEG 8000, (G) SD with PEG 8000, (H) HP-β-CD, (I) PM with HP β-CD, (J) IC with HP β-CD, (K) PM with PVP-K30, (L) Nano with PVP-K30, (M) PM with PVP-K90, and (N) nanoparticles with PVP-K90.
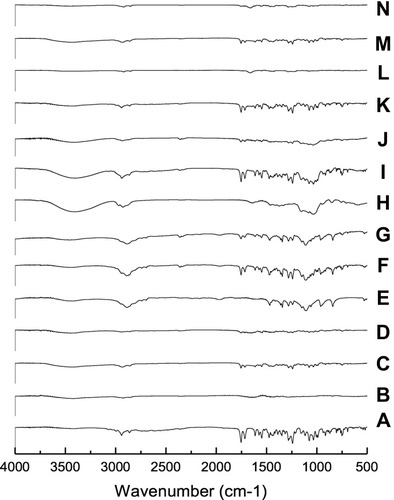
Figure 7 DSC thermograms of (A) CC, (B) PVP-K90, (C) PM with PVP-K90, (D) SD with PVP-K90, (E) PEG8000, (F) PM with PEG 8000, (G) SD with PEG 8000, (H) HP-β-CD, (I) PM with HP β-CD, (J) IC with HP β-CD, (K) PM with PVP-K30, (L) Nano with PVP-K30, (M) PM with PVP-K90, and (N) nanoparticles with PVP-K90.
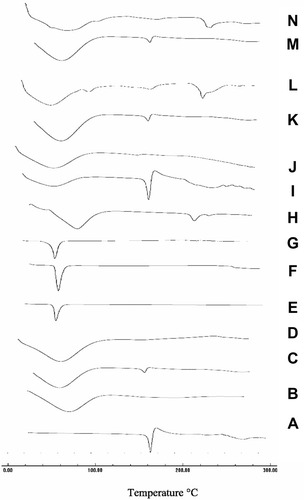
Figure 8 The 3D structures of CC and two cyclodextrins (β-CD and HP-β-CD), showing the predicted orientations of CC within the hydrophobic cavity of β-CD (A) and HP-β-CD (B) from the side view as well as its binding interactions with the hydrophilic edges of β-CD (C) and HP-β-CD (D) as stick molecular depiction. Hydrogen bonds and hydrophobic interactions are demonstrated as black and red dashed lines, respectively.
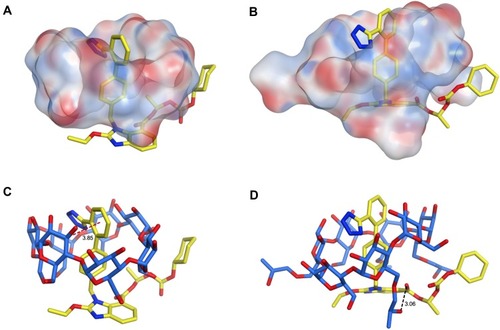
Figure 9 Issolution rate of (A) CC/PVP-K30, (B) CC/PVP-K90, (C) CC/PEG4000, (D) CC/PEG6000, (E) CC/PEG8000, (F) CC/CD, and (G) CC/NP. Data represent mean cumulative % released ± SEM.
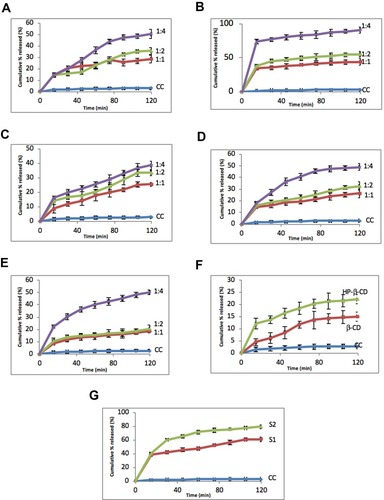
Figure 10 UPLC MS/MS spectrum of Candesartan and the I.S. (Pitavatatin) showing the retention time of CC and I.S.
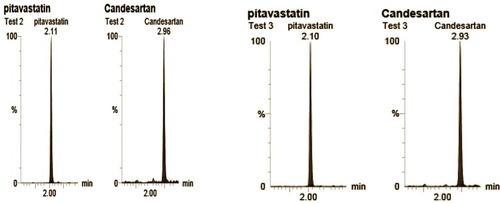
Table 3 Pharmacokinetic Parameters of Candesartan in Plasma of Rabbit After Oral Administration of 20 Mg of CC as a Solid Dispersion and CC Alone.
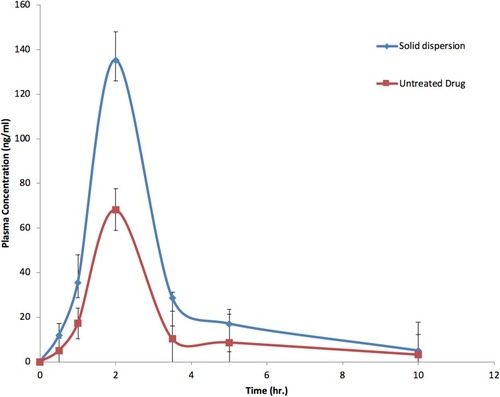
Figure 11 Concentration-time profiles of CC alone and in SDs with PVP K-90 (data displayed±SEM).