Figures & data
Figure 1 (A) Pharmacophore model based on the reported mTOR inhibitors and the lead compound B170422 screened out by the pharmacophore model; (B) schematic of the binding mode of B170422 with mTOR.
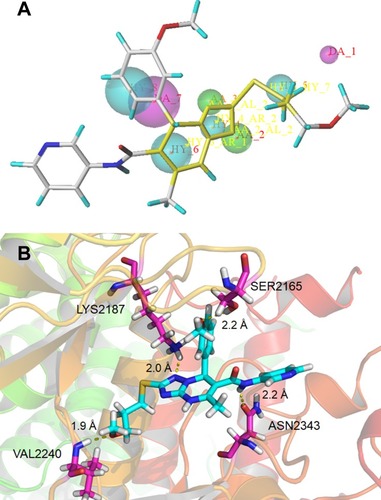
Figure 2 Hits obtained by virtual screening.
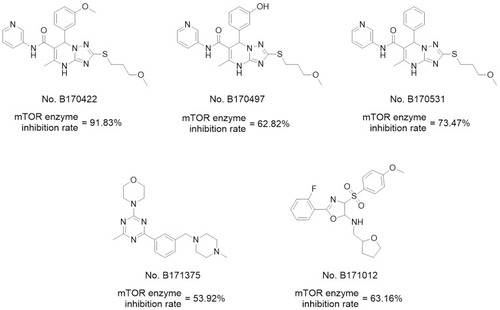
Figure 3 Superposition of three-dimensional protein crystal structures of mTOR and PI3Kα. Red: mTOR (4JSV); green: PI3Kα (6OAC). The ATP binding pocket of mTOR and PI3Kα is represented by solid tube; the other parts are represented by ribbon.
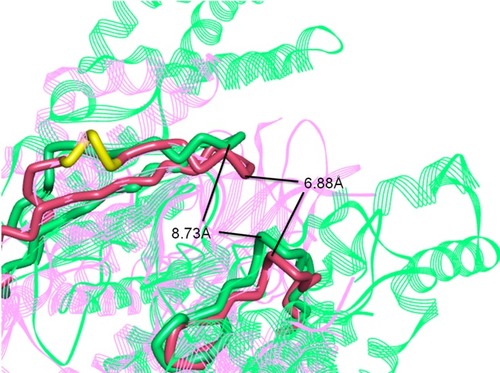
Figure 4 Representative mTOR inhibitors and PI3K inhibitors.
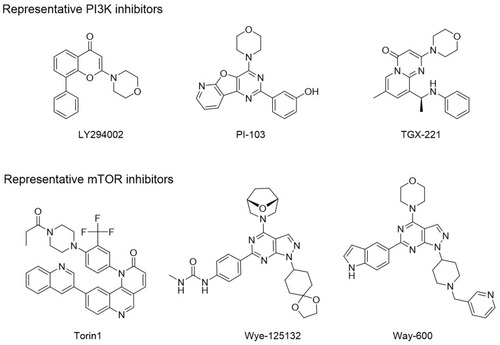
Table 1 Structures, Enzyme Inhibitory Activities, and Selectivities of 1a–1d and 2a–2j 
Table 2 Structures, Enzyme Inhibitory Activities, and Selectivities of 3a–3h
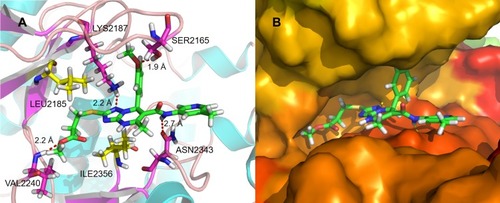
Figure 5 (A) Schematic of the binding mode of 2a with mTOR; (B) image of the mTOR surface around 2a.
Scheme 1 The synthetic route of 2a. Reagents and conditions: (A) NaOH, ethyl alcohol, rt; (B) triethylamine, methylbenzene, 100°C; (C) ethyl alcohol, 80°C.
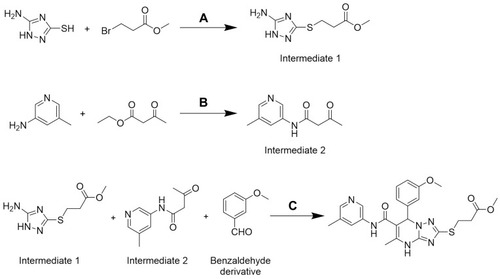
Table 3 Comparison of the Inhibitory Activity of 2a on mTOR Enzyme and MHCC97-H Cells at Different Concentrations (Considering the Experimental Error, the Number of Decimal Places Has Been Optimized)
Figure 6 Compound 2a enhances the sensitivity of MHCC97-H cells to IR. MHCC97-H cells pretreated with 2a were treated with the indicated dose (0, 2, 4, or 8 Gy) of 60Co-γ IR and were examined by colony formation experiments. (A) Experimental results are shown as images of colonies; (B) experimental results are shown as inhibition rates (mean ± SD). *p<0.05 versus solvent control or 2a.
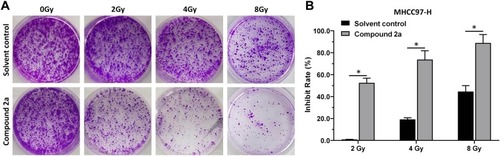
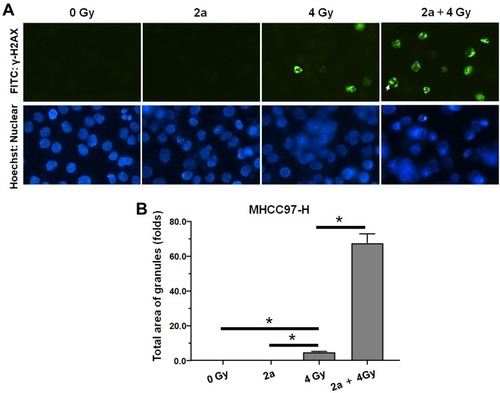
Figure 7 Compound 2a enhances DNA DSBs induced by 60Co-γ IR in MHCC97-H cells. (A) 2a enhances the γ-H2aX foci induced by IR (4 Gy) in nuclear of MHCC97-H cells; (B) the total area of granules of γ-H2aX foci (mean ± SD). *p<0.05.