Figures & data
Figure 1 OxLDL-induced growth inhibition of HUVECs was significantly reversed by HOXA-AS3 knockdown. (A) HUVECs were treated with 0, 50, 75 or 100 μg/mL oxLDL for 48 h. Then, the expression of HOXA-AS3 in HUVECs was detected by RT-qPCR. (B) HUVECs were transfected with HOXA-AS3 siRNA1, siRNA2 or siRNA3 for 24 h. Then, the expression of HOXA-AS3 in HUVECs was measured by RT-qPCR. (C) HUVECs were treated with oxLDL (100 μg/mL), HOXA-AS3 siRNA2 or oxLDL + HOXA-AS3 siRNA2 for 0, 24, 48 or 72 h. The viability of HUVECs was detected by CCK-8 assay. (D) The proliferation of HUVECs was detected by Ki67 staining. The Ki67 positive rate was calculated. Red immunofluorescence indicated Ki67. Blue immunofluorescence indicated DAPI. *P< 0.05 compared to control, **P< 0.01 compared to control, ##P< 0.01 compared to oxLDL (100 μg/mL); n = 3.
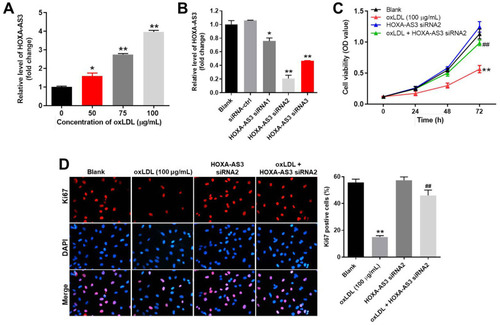
Figure 2 HOXA-AS3 sponged miR-455-5p in HUVECs. (A) Gene structure of HOXA-AS3 indicated the predicted target site of miR-455-5p in its 3ʹUTR. (B) HUVECs were transfected with 10 μM miR-455-5p agomir or antagomir. Then, the efficiency of transfection was verified by RT-qPCR. (C) The luciferase activity was measured in HUVECs following co-transfecting with WT/MT HOXA-AS3 3′-UTR plasmid and miR-455-5p with the dual luciferase reporter assay. (D) RNA pulldown was performed to verify the correction between HOXA-AS3 and miR-455-5p. **P<0.01 compared with control; n = 3.
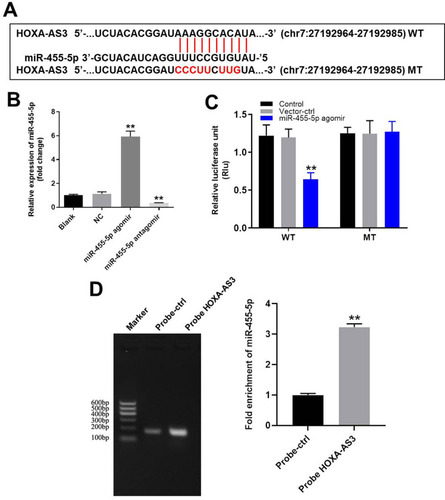
Figure 3 HOXA-AS3 siRNA2 notably suppressed oxLDL-induced apoptosis of HUVECs via sponging miR-455-5p. HUVECs were treated with oxLDL (100 μg/mL), oxLDL + HOXA-AS3 siRNA2 or oxLDL + HOXA-AS3 siRNA2 + miR-455-5p antagomir. (A) Changes in mitochondrial membrane potential (MMP) were measured with JC-1 staining on the FACSan flow cytometer. The ratio of mitochondrial membrane potential (MMP) was calculated. (B) Cell apoptosis was detected with Annexin V/PI staining. The rate of apoptotic cells was detected by FACS. X axis: the level of Annexin-V FITC fluorescence; Y axis: the PI fluorescence. (C) The protein expressions of Bax, cleaved caspase 3, Bcl-2, cleaved caspase 9 in HUVECs were detected by Western blot. (D) The relative expression of Bax was quantified via normalizing to β-actin. (E) The relative expression of cleaved caspase 3 was quantified via normalizing to β-actin. (F) The relative expression of Bcl-2 was quantified via normalizing to β-actin. (G) The relative expression of cleaved caspase 9 was quantified via normalizing to β-actin. **P<0.01 compared with control, ##P<0.01 compared to oxLDL (100 μg/mL), ^P<0.05, ^^P<0.01 compared to oxLDL (100 μg/mL) + HOXA-AS3 siRNA2; n = 3.
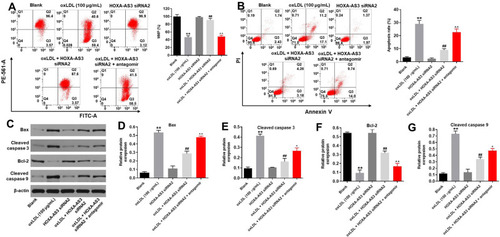
Figure 4 HOXA-AS3 knockdown obviously inhibited the progression of angiogenesis in vitro. (A) The formation of capillary-like structures was photographed in HUVECs was pictured. (B) The branch points were calculated. (C) The capillary length was tested. **P<0.01 compared with control, ##P< 0.01 compared to oxLDL (100 μg/mL), ^^P<0.01 compared to oxLDL (100 μg/mL) + HOXA-AS3 siRNA2; n = 3.
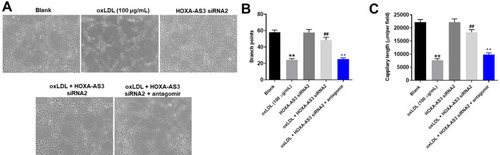
Figure 5 MiR-455-5p directly targeted p27 Kip1. (A) Gene structure of p27 Kip1 at the position of 279–285 indicates the predicted target site of miR-455-5p in its 3ʹUTR. (B) The luciferase activity was measured after co-transfecting with WT/MT p27 Kip1 3′-UTR plasmid and miR-455-5p agomir in HUVECs using the dual luciferase reporter assay. The results were normalized to Renilla luciferase. (C) HUVECs were transfected with miR-455-5p agomir or NC for 24 h. Then, the expression of p27 Kip1 in HUVECs was detected by RT-qPCR. (D) Protein expression of p27 Kip1 in HUVECs was detected by Western blot. (E) The relative expression of p27 Kip1 was quantified via normalization to β-actin. **P<0.01 vs. control group; n = 3.
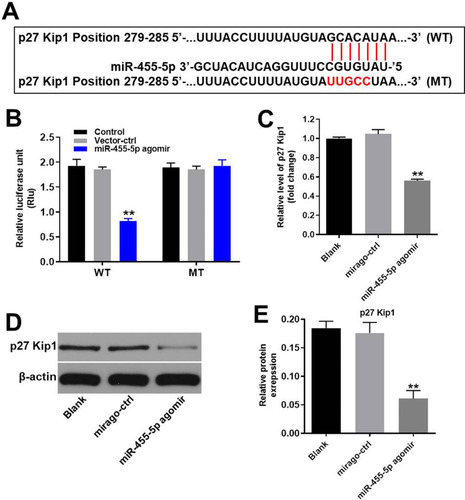
Figure 6 HOXA-AS3 mediated the cycle of HUVECs via sponging miR-455-5p. (A) The cell cycle distribution in G0/G1, S, and G2 phase after propidium iodide (PI) staining of HUVECs were determined by FACS. (B) The expressions of p27 Kip1, CDK2 and Cyclin E1 in HUVECs were detected by Western blot. (C) The relative expression of p27 Kip1 was quantified via normalizing to β-actin. (D) The relative expression of CDK2 was quantified via normalizing to β-actin. (E) The relative expression of Cyclin E1 was quantified via normalizing to β-actin. **P<0.01 compared with control, ##P<0.01 compared to oxLDL (100 μg/mL), ^^P<0.01 compared to oxLDL (100 μg/mL) + HOXA-AS3 siRNA2; n = 3.
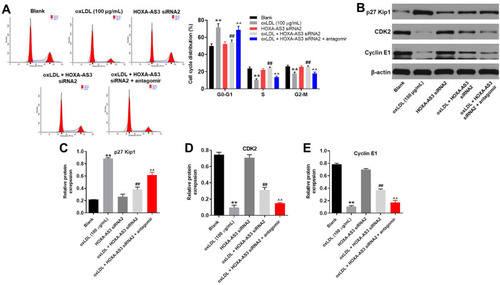
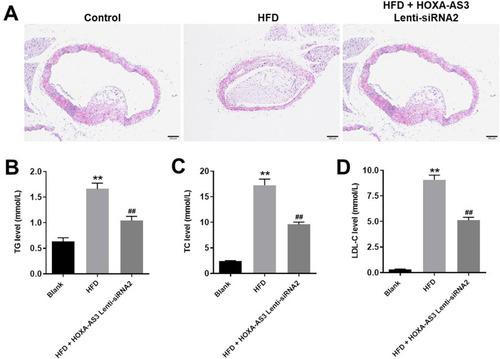
Figure 7 HOXA-AS3 siRNA2 significantly alleviated the symptom of atherosclerosis in vivo. Mice were sacrificed at the end of the study and then the arterial tissues and serum were collected. (A) The pathologic condition of the coronary artery was analyzed by H&E (magnification: ×100). The levels of (B) TG, (C) TC and (D) LDL-C in serum of mice were detected by Blood Lipid Biochemistry Kit. **P<0.01 compared with Blank, ##P<0.01 compared with HFD; n = 5.