Figures & data
Figure 1 Schematic of sub-Tenon micro-perfusion of CP in rabbit. CP was released via sub-Tenon micro-perfusion system consisting of a catheter, a micro-needle, and a micro-pump, then it permeated into the vitreous from the scleral surface.
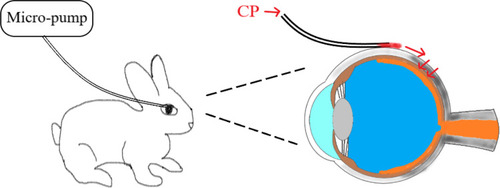
Table 1 Cyclophosphamide Concentrations in the Plasma, Vitreous Humor, and Retina/Choroid in SMS and SI Groups
Figure 2 CP distribution characteristics in plasma, vitreous humor, and retina/choroid via SMS and SI.
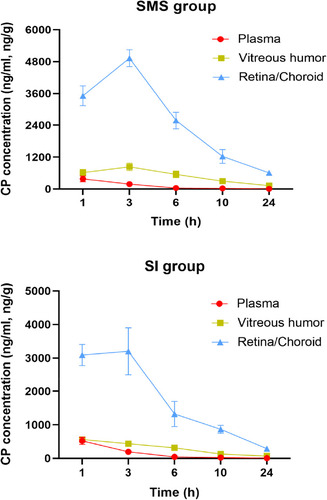
Table 2 Pharmacokinetics of Cyclophosphamide in Plasma, Vitreous Humor, and Retina/Choroid via SMS and SI
Figure 3 Images of the ocular appearance for the control group (A and D), SI group (B and E), and SMS group (C and F) on post-treatment days 3 and 7. The eyes in the control group had severe anterior chamber fibrin and vitreous opacity, whereas there were less inflammatory signs in the SI group and SMS group. The eyes at day 7 in the SMS group appeared normal. The arrow indicates the response of inflammation.
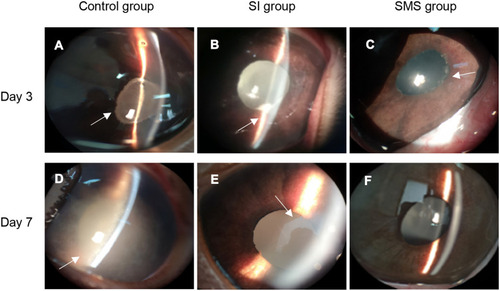
Figure 4 Clinical signs of inflammatory response in control group, SI group and SMS group. Mean anterior chamber fibrin scores (A) and mean vitreous opacity scores (B) were assessed on post-treatment days 3 and 7 (n=8). #P<0.05, ##P<0.01.
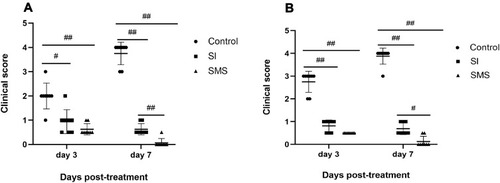
Figure 5 Representative histopathologic section images of the retina in the control group (A), SI group (B), SMS group (C), and normal rabbits (D) (20× magnification; Scale bar −50 µm). Sections of the retina were photographed on post-treatment day 8. Histological scores of the retina in the control group, SI group, and SMS group (E). *P<0.05, **P<0.01.
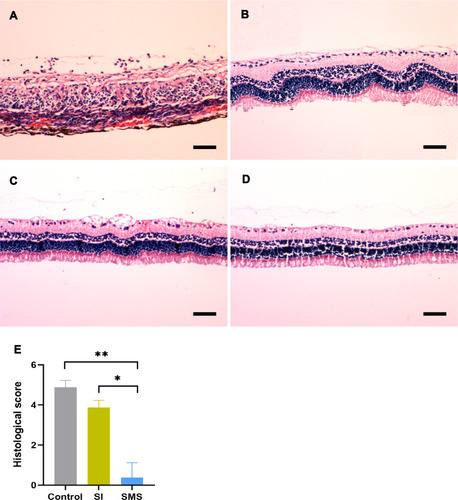
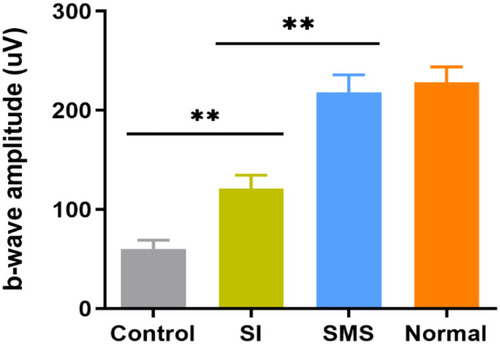
Figure 6 Scotopic ERG responses in the control group, SI group, SMS group, and normal rabbits. Mean b-wave amplitude in all groups were observed on post-treatment day 8 (n=8 eyes for each group). Error bars represent the SD, **P<0.01.