Figures & data
Figure 1 The mRNA expression of cGAS, Sting and NLRP3 in IDD cases. (A) The expression of cGAS, Sting and NLRP3 in IDD patients and controls. (B) The correlation analyses of cGAS mRNA and NLRP3. (C) The correlation analyses of Sting mRNA and NLRP3. The linear trend was fitted by linear regression method. ***P < 0.001.
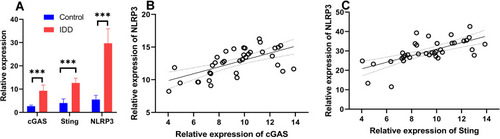
Figure 2 The effect of EGCG of cell viability in H2O2 treatment-induced NPCs. (A) NPCs cell viability treated by H2O2 from Day 0 to Day 5. (B) EGCG in 5 μM and 25 μM treatment for the NPCs treated by H2O2. ***P < 0.001.
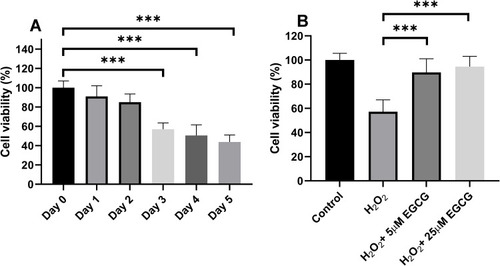
Figure 3 Effect of EGCG on apoptosis and cell cycle in H2O2 treatment-induced NPCs. (A) The apoptosis rate was detected in EGCG in 5 μM and 25 μM treatment for H2O2-treated NPCs; (B) the cell cycle was detected in EGCG in 5 μM and 25 μM treatment for H2O2-treated NPCs. ***P < 0.001. n = 4.
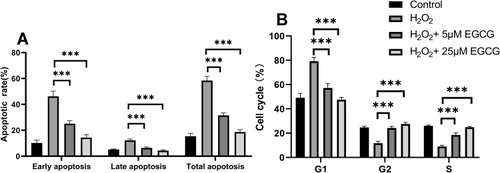
Figure 4 Effect of EGCG on apoptosis-associated genes, including caspase-3, caspase-9, Bax and Bcl-2 in H2O2-treated NPC cell by Western blotting. (A) protein of caspase-3, caspase-9, Bax and Bcl-2 in control, H2O2 treatment, 5 μM EGCG in H2O2 treatment and 25 μM EGCG in H2O2 treatment group; (B) the relative expression of caspase-3, caspase-9, Bax and Bcl-2 in control, H2O2 treatment, 5 μM EGCG in H2O2 treatment and 25 μM EGCG in H2O2 treatment group. n=3, *P < 0.05, **P < 0.01, ***P < 0.001.
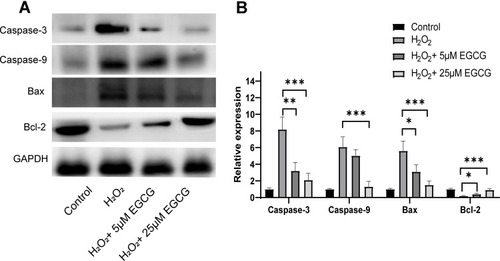
Figure 5 Effect of EGCG on cell migration of EGCG treatment on H2O2-treated NPCs. (A) Cell migration in control, H2O2 treatment, 5 μM EGCG in H2O2 treatment and 25 μM EGCG in H2O2 treatment group; (B) summary of cell migration in control, H2O2 treatment, 5 μM EGCG in H2O2 treatment and 25 μM EGCG in H2O2 treatment group. **P < 0.01, ***P < 0.001.
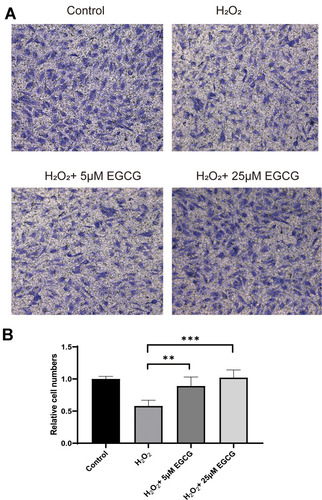
Figure 6 Expression of cGAS, Sting and NLRP3 in EGCG-treated NCPs with H2O2-treated NPCs. (A) the expression of cGAS, Sting and NLRP3 in control, H2O2 treatment, 5 μM EGCG in H2O2 treatment and 25 μM EGCG in the H2O2 treatment group; (B) summary of expression of cGAS, Sting and NLRP3 in EGCG-treated NCPs with H2O2-treated NPCs. **P < 0.01, ***P < 0.001.
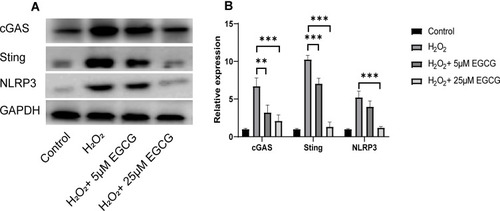
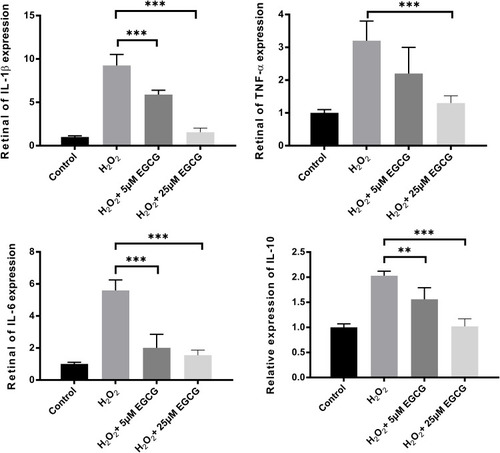
Figure 7 Effects of EGCG of the pro-inflammatory factor expression in H2O2-treated NPCs. The expression of several pro-inflammatory factors was detected by ELISA and presented in IL-1β, TNFα, IL6 and IL6. **P < 0.01, ***P < 0.001. n = 4.