Figures & data
Figure 1 UTI accelerated function recovery of nerves after sciatic nerve injury. (A) SFI method was used to evaluate the function recovery after sciatic nerve injury, n = 4/group. (B and C) UTI treatment significantly affected the amplitude (B) and latency (C) of CMAP, n = 3/group. *P < 0.05, **P < 0.01, and ***P < 0.001.
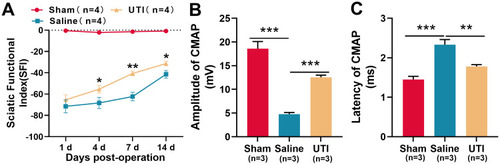
Figure 2 UTI was beneficial for myelinogenesis and nerve regeneration after sciatic nerve injury. (A) and (B) MAG and PMP22 expressions were analyzed by Western blot, n = 3/group. (C and D) GAP43 and NF200 expressions were analyzed by Western blot, n = 3/group. **P < 0.01, and ***P < 0.001.
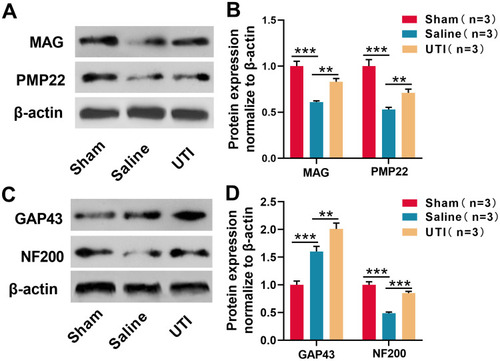
Figure 3 Expressions of let-7 family members in the sciatic nerve of rats after sciatic nerve injury. (A–H) qRT-PCR was used to detect the relative expression levels of eight members of let-7 family: (A) let-7a; (B) let-7b; (C) let-7c; (D) let-7d; (E) let-7e; (F) let-7f; (G) let-7i; (H) miR-98, n = 3/group. *P < 0.05, and ***P < 0.001.
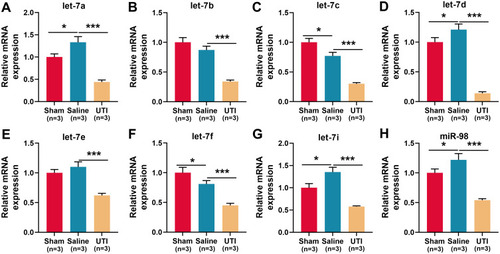
Figure 4 NGF was a target gene of let-7. (A)TargetScan databases was employed to predict the target sites between let-7 microRNAs and NGF, and NGF wild-type and mutant reporter vectors were constructed. (B) Dual-luciferase reporter gene experiments were used to verify the targeting relationship between let-7 and the 3ʹUTR of NGF. (C–D) qRT-PCR and Western blot were used to detect the expression levels of NGF mRNA and protein in the sciatic nerve of rats, n = 3/group. *P < 0.05, **P < 0.01, and ***P < 0.001.
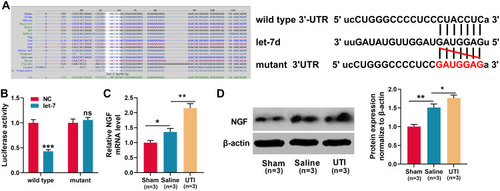
Figure 5 Let-7 regulated the migration and proliferation of Schwann cells through NGF. (A) Let-7 mimics and pcDNA3.1-NGF were transfected into Schwann cells, and Western blot was used to detect the expression of NGF protein. (B and C) The migration (B) and proliferation (C) of Schwann cells were detected by Transwell assay and EdU assay respectively. (D) Let-7 inhibitors and NGF siRNA were transfected into Schwann cells, and Western blot was used to detect the expression of NGF protein. (E and F) The migration (E) and proliferation (F) of Schwann cells were detected by Transwell assay and EdU assay respectively. **P < 0.01, and ***P < 0.001.
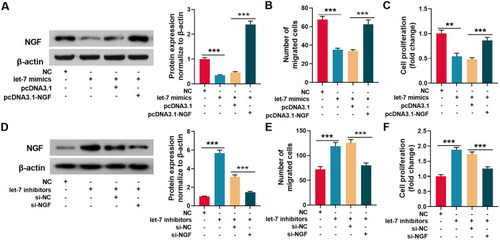
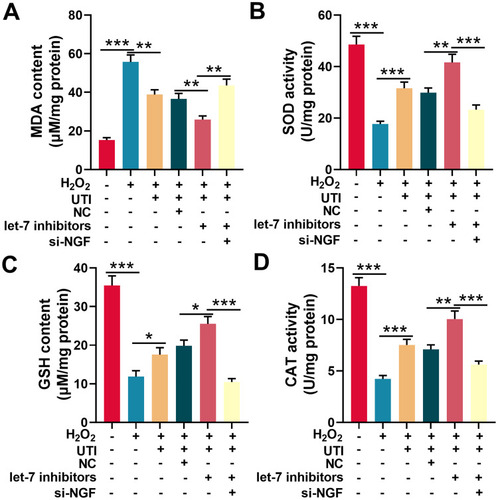
Figure 6 UTI repressed oxidative stress of Schwann cells induced by H2O2. MDA level (A), SOD activity (B), GSH level (C) and CAT activity (D) were detected with corresponding kit respectively after Schwann cells were incubated with H2O2. *P < 0.05, **P < 0.01, and ***P < 0.001.