Figures & data
Figure 1 Sarsasapogenin attenuates RANKL-induced osteoclast formation in vitro. (A) Chemical structure of sarsasapogenin. (B) Viability of M-CSF-dependent BMMs following treatment with sarsasapogenin for 48 h or 96 h as assessed by MTT assay (n = 3). (C) Representative images showing the dose-dependent effect of sarsasapogenin on osteoclast formation. BMMs stimulated with 100 ng/mL RANKL in the absence or presence of indicated concentrations of sarsasapogenin for 7 days were fixed and stained for TRAP activity (magnification = 100×; scale bar = 100 μm). (D) Numbers and area of TRAP-positive multinucleated osteoclasts with more than 3 nuclei were quantified by ImageJ (n = 3). (E) Representative images showing the time-dependent effect of sarsasapogenin on osteoclast formation. BMMs stimulated with RANKL and treated with 4 μM sarsasapogenin on the indicated days were fixed and stained for TRAP activity (magnification = 100×; scale bar = 100 μm). (F) Numbers and area of TRAP-positive multinucleated osteoclasts with more than 3 nuclei were quantified by ImageJ (n = 3). Bar graphs present the mean ± SD; **p < 0.01, and ***p < 0.001 versus RANKL-only treated control.
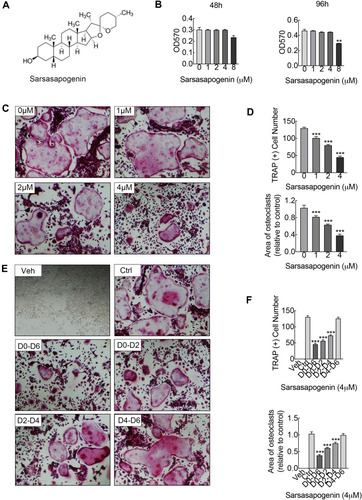
Table 1 Mouse Primers for qPCR
Figure 2 Sarsasapogenin inhibits F-actin ring and bone resorption in vitro. (A) Effect of sarsasapogenin on the fusogenic potential of osteoclast precursor cells. Representative immunofluorescence images of F-actin rings (Acti-stain™ 488 Fluorescent Phalloidin; green) from BMM-derived osteoclasts stimulated with 100 ng/mL RANKL with or without the indicated concentrations of sarsasapogenin. Nuclei were counterstained with DAPI (blue) (magnification = 100×; scale bar = 100 μm). (B) Equal numbers of pre-osteoclasts were seeded onto bone slices and stimulated with M-CSF and RANKL in the presence of different concentrations of sarsasapogenin. After 3 days, bone resorption lacunae were observed by SEM (magnification = 200 ×; scale bar = 100 μm). (C) F-actin rings were quantified using ImageJ (n = 3). (D) The resorption pit area (%) was quantified using ImageJ (n = 3). (E) Dose-dependent mRNA expression profile of osteoclast marker genes. RT-qPCR was conducted using RNA extracted from cells stimulated with 100 ng/mL RANKL with or without the indicated concentrations of sarsasapogenin for 5 days. mRNA levels of c-FOS, NFATc1, DC-STAMP, ATP6V0d2, TRAP, and CTSK were normalized to that of β-actin and then compared to RANKL-only control (0) to obtain the relative fold change (n = 3). Bar graph presents the mean ± SD. **p < 0.01, and ***p < 0.001 versus RANKL-treated only control.
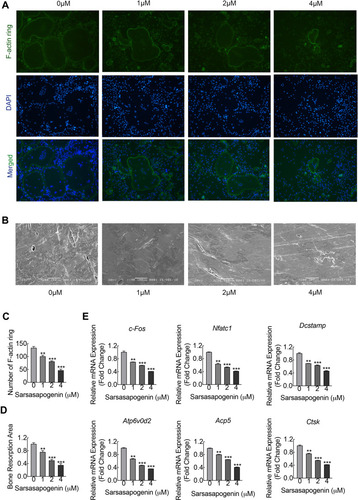
Figure 3 Sarsasapogenin attenuates RANKL-induced activation of the NF-κB and JNK/MPAK signaling pathways. (A–C) BMMs were pretreated with 4 μM sarsasapogenin for 1 h and then stimulated with RANKL for the indicated periods. Cell lysates were probed for protein levels using Western blot analysis (n = 3). (D) Relative changes in the phosphorylation statuses of p65, Akt, ERK, p38, and JNK were determined by densitometry and expressed as a ratio against its total protein counterpart, and the expression of Iκβα relative to actin, were determined using ImageJ. (E) Sarsasapogenin prevents p65 nuclear translocation and localization. Representative immunofluorescence images of p65 localization (red) in BMMs treated with sarsasapogenin and stimulated with RANKL. Nuclei were counterstained with DAPI (blue). (F) The relative frequency of nuclear and cytoplasmic p65 under each experimental condition was quantified using ImageJ (n = 3). (G) Total cellular proteins extracted from BMM-derived osteoclasts co-treated with RANKL and 4 μM sarsasapogenin for 0, 1, 3, or 5 days were subjected to immunoblot analyses using specific antibodies to NFATc1. β-Actin was used as an internal loading control. (n = 3). Total BMM-derived osteoclasts were cultured with RANKL (100 ng/mL) and M-CSF (25 ng/mL) with or without sarsasapogenin (4 μM) for 0, 1, 3, or 5 days. Cell lysates were probed for NFATc1 protein levels using Western blot analysis (n = 3). (H) Relative expression of NFATc1 was determined by densitometry and expressed as a ratio versus actin. Bar graphs represent the mean ± SD; *p < 0.05 versus respective controls.
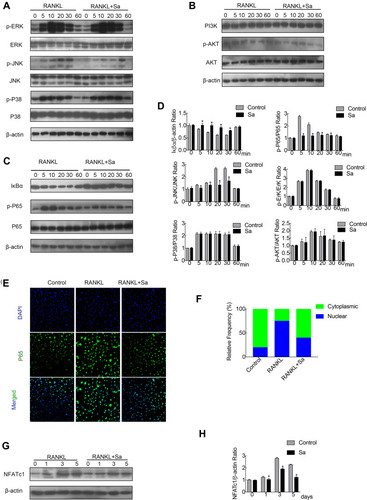
Figure 4 Sarsasapogenin protects against LPS-induced bone loss in vivo. (A) Micro-CT scanning and 3D reconstruction of the entire caldaria of mice from the sham (PBS), LPS (5 mg LPS/kg body weight), low-dose sarsasapogenin (5 mg LPS/kg and 5 mg sarsasapogenin/kg), and high-dose sarsasapogenin (5 mg LPS/kg and 10 mg sarsasapogenin/kg) groups (n = 6). Scale bar = 1 mm. (B) Quantitative analysis of BV/TV (n = 6). (C) Percentage porosity (n = 6). Data represent the mean ± SD; **p < 0.01 and ***p < 0.001 versus respective controls.
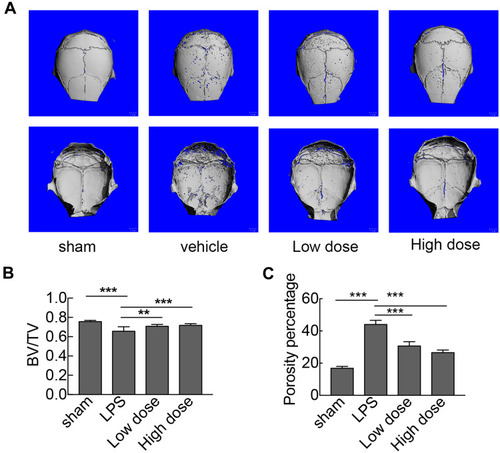
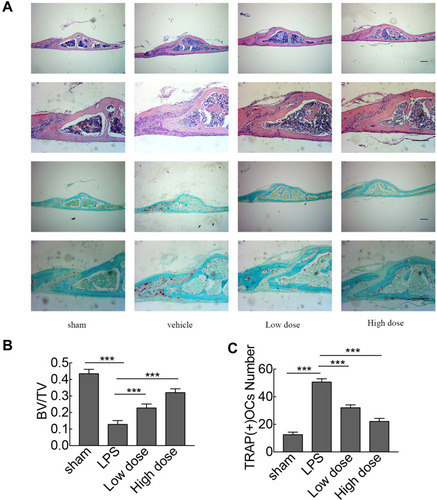
Figure 5 Histological and histomorphometric analyses of the effect of sarsasapogenin on LPS-induced bone loss in vivo. (A) Representative images of calvaria stained with H&E and TRAP from the sham group (PBS; control), LPS (5 mg LPS/kg body weight), low-dose sarsasapogenin (5 mg LPS/kg and 5 mg sarsasapogenin/kg), and high-dose sarsasapogenin group (5 mg LPS/kg and 10 mg sarsasapogenin/kg) (n = 6) (scale bar = 200μm). (B and C) Quantification of BV/TV and TRAP (+) cell number (n = 6). Data represent the mean ± SD; ***p < 0.001 versus respective controls.