Figures & data
Table 1 The Characterization of SAA-BTL Liposomes
Figure 1 Live/dead assay and actin cytoskeleton observation of ATDC 5 cells seeded on SAA/SAA-BTL-incorporated collagen sponges. (A) Live/dead assay for ATDC 5 cells seeded on SAA/SAA-BTL-incorporated collagen sponges after 24h. (B) Cytoskeleton observation of ATDC 5 cells seeded on SAA/SAA-BTL-incorporated collagen sponges after 48h. Quantitative data from the Live/dead assay are shown in .
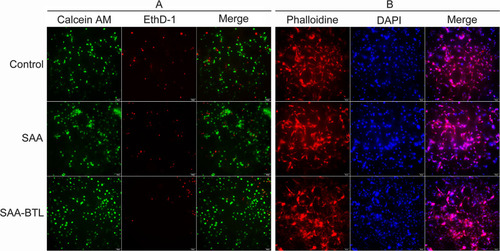
Figure 2 X-ray, micro-CT, and histology evaluations of fractured radius calluses from the rabbits of the control, SAA, and SAA-BTL group. (A) X-ray images from representative specimens at the 1st and 4th weeks post-fracture. (B) Micro-CT images of fracture calluses from representative samples at the 4th week post-surgery. (C) Micro-CT quantitative data of fracture calluses from different groups. The region of interest (ROI) was 2.5 mm below and above the middle line of the defect. BV, bone volume; TV, tissue volume; BV/TV, the ratio of bone volume to tissue volume. *P< 0.05. (D) Histologic images of fracture calluses from representative specimens at the 4th week post-surgery. Callus sample was stained with safranin O. The chondrocyte area shows red color within the callus.
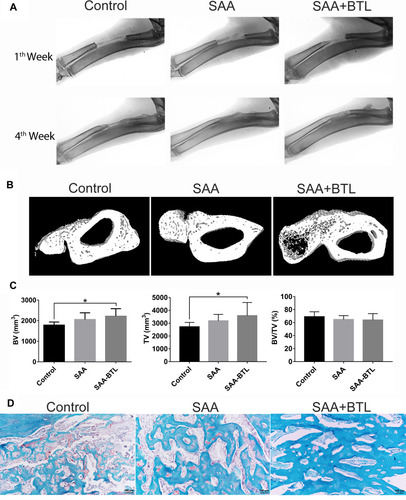
Figure 3 Immunofluorescence analysis of collagen II and P-HDAC 3 expression in fracture calluses at the 4th week post-surgery. P-HDAC3 and collagen II expression was quantified in sections of the callus. These data are shown in .
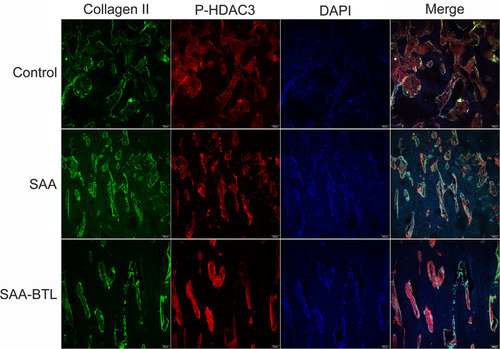
Figure 4 Immunofluorescence analysis of collagen II and osteocalcin expression in fracture calluses at the 4th week post-surgery. Osteocalcin and collagen II expression were quantified in sections of the callus. These data are shown in .
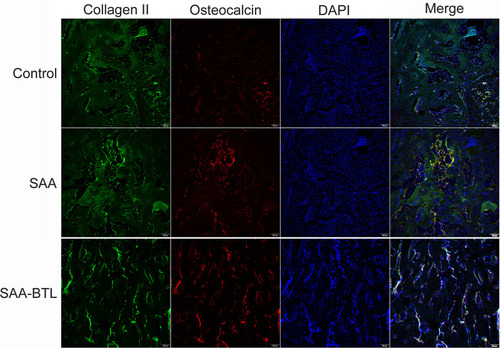
Figure 5 Immunofluorescence analysis of collagen II and RUNX2 expression in fracture calluses at the 4th week post-surgery. RUNX2 and collagen II expression were quantified in sections of the callus. These data are shown in .
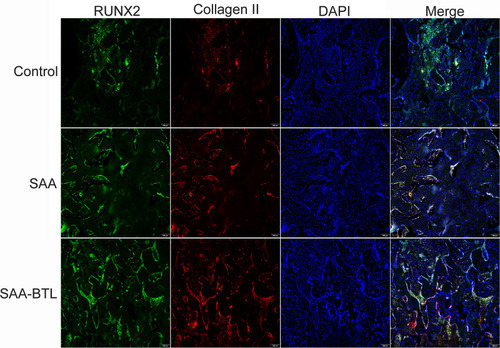
Figure 6 Immunofluorescence analysis of collagen II and VEGFA expression in fracture callus at the 4th week post-surgery. VEGFA and collagen II expression was quantified in sections of the callus. These data are shown in .
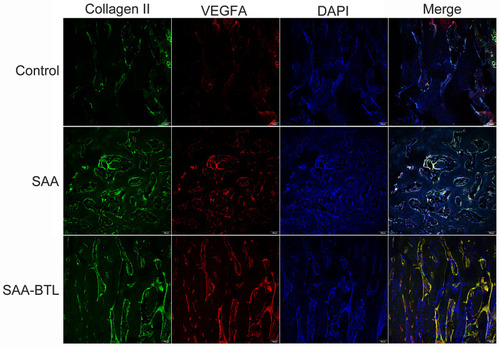
Figure 7 (A–E) Quantitative data from immunofluorescent analysis of P-HDAC3, osteocalcin, RUNX2, collagen II, and VEGFA expression in fracture calluses at the 4th week post-surgery (N=5) (F) Quantitative data from the live/dead analysis of ATDC 5 cells seeded on SAA/SAA-BTL-incorporated collagen sponges for 24 h of incubation. *P< 0.05.
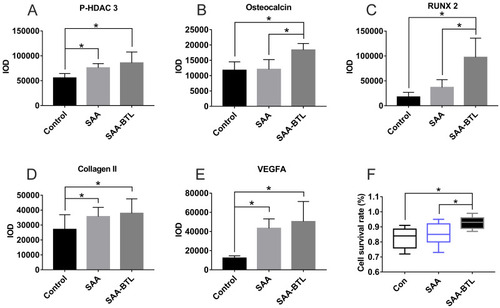
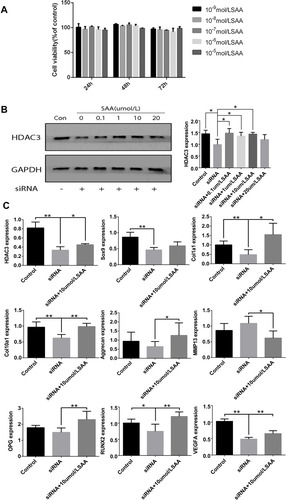
Figure 8 The impact of SAA treatment on ATDC5 cells. (A) Cell viability of ATDC5 cells treated with SAA for 24, 48, and 72h. (B) HDAC3 protein expression in ATDC5 HDAC3-knockdown cells treated with SAA for 48h. (C) RT-qPCR analysis of gene expression in the ATDC5 HDAC3-knockdown cells treated with SAA for 72h. *P< 0.05, **P <0.01.