Figures & data
Figure 1 Tranilast inhibited TGFβ2-induced expression of mesenchymal markers and ECM synthesis via TGFβ/SMAD2 pathway in A549 cells. A549 cells were treated with various concentrations (50, 100, and 200 μM) of tranilast in presence or absence of 5 ng/mL TGFβ2 for 72 h. (A) Expression levels of N-cadherin, fibronectin, and COL4A1 mRNA was analyzed by quantitative polymerase chain reaction (qPCR). TGFβRI: TGFβ receptor inhibitor. (B) Expression of proteins E-cadherin, N-cadherin, fibronectin, and COL4A1 was analyzed by Western blotting. (C) Fold changes were calculated by setting the ratios of the any protein/β-actin band intensities. (D) A549 cells were treated with tranilast in presence or absence of 5 ng/mL TGFβ2 for evaluation of SMAD2. The phosphorylation level of Smad2 was analyzed by Western blotting. (E) Fold changes were calculated by setting the ratios of the phospho protein/total protein band intensities. (F) A549 cells with or without TGFβ2 stimulation were treated with tranilast for evaluation of TGFβ and transcriptional factors. Expressions of mRNA levels for TGFβ1, TGFβ2, ZEB-1, and Slug were evaluated by qPCR. Each bar represents mean ± SD of three independent experiments. *p < 0.01.
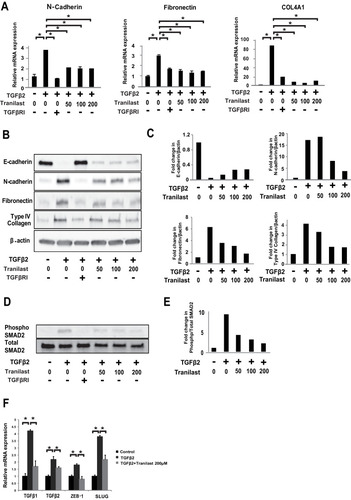
Figure 2 Tranilast attenuated cell migration and foci formation in A549 cells. (A) A549 cells with or without TGFβ2 (5 ng/mL) stimulation were incubated with 100 or 200 μM tranilast for 48 h and a wound was created by scratching the cell monolayer to assess cell migration; the wound area was evaluated. Photos of sections were taken under 200 × magnification using a microscope (Olympus, Japan) with a CCD camera. Wound areas were measured by ImageJ. Wound healing ratio in each well was calculated by dividing the wound areas. (B) To evaluate foci formation, A549 cells were incubated in presence of TGFβ2 (5 ng/mL) and TNFα (100 ng/mL) in 24-well chambers. Following 48 h stimulation, photos of sections were taken using a microscope fitted with a CCD camera. (C) Foci were strongly immunostained with fibronectin antibody. (D) Fibrotic foci ratio (FFR) was calculated by dividing the areas of foci with the area of the target field at six randomly selected wells using ImageJ. (E) The effect of several concentrations of tranilast (50, 100, and 200 μM) on foci formation in A549 cells. These cells in each group were observed after TGFβ2 stimulation with or without tranilast. The average of FFR was calculated for each group. Each bar represents mean ± SD of three independent experiments. *p < 0.01, **p < 0.05.
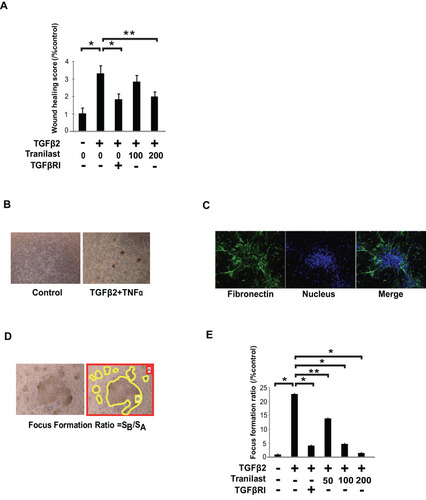
Figure 3 Tranilast attenuated BLM-induced pulmonary fibrosis in mice. (A) Histological examination was performed by hematoxylin-eosin (HE) as well as Masson trichrome (MT) staining. Bar = 200 µm. (B) The grade of pulmonary fibrosis was evaluated by the method described by Ashcroft and coworkers.Citation19 Treatment groups were composed of saline-treated with vehicle (n = 10), saline-treated with tranilast (n = 10), BLM-treated with vehicle (n = 9), and BLM-treated with tranilast (n = 9). More than 30 randomized fields of each of the five lung lobes in mice were examined. Fibrotic score is presented as mean ± SD of all the fields examined in each group. *p < 0.01.
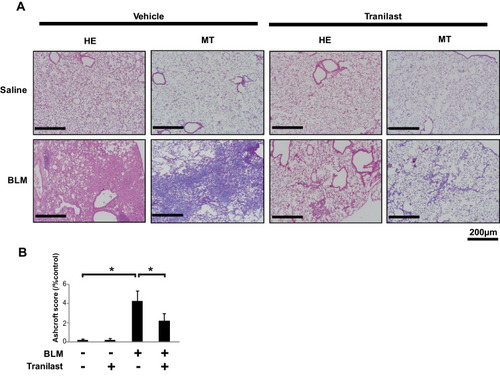
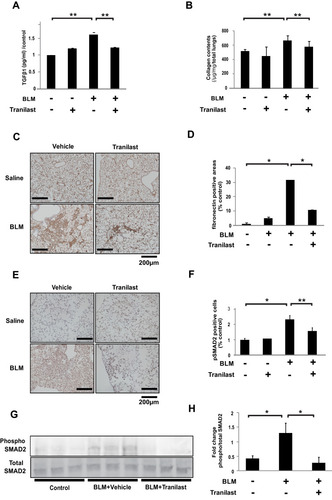
Figure 4 Tranilast attenuated BLM-induced ECM production and phosphorylation of SMAD2 in mice. (A) TGFβ1 concentration in BAL fluid was evaluated by ELISA. (B) Effects of tranilast on collagen contents. Data are presented as mean ± SD in each group of 10 mice. **p < 0.05. (C) Effect of tranilast on expression of fibronectin in the murine lungs by immunohistochemistry (IHC). Bar = 200 µm. (D) The average of the percentage of fibronectin positive ratio in each of the four groups was calculated by dividing the average of each group with that of the control group. Data are presented as mean ± SD in each group of 10 mice. *p < 0.01. (E) IHC staining for phospho-SMAD2 in the murine lungs. (F) The phospho-Smad2-positive cells were counted in 10 fields at × 200 magnification. Bar = 200 µm. The average of the percentage of phospho-SMAD2-positive cells in each of the four groups was calculated by dividing the average of each group with that of the control group. Data are presented as mean ± SD in each group of 10 mice. *p < 0.01, **p < 0.05. (G) Levels of phospho- and total-SMAD2 in the whole lung lysates of mice by Western blotting analysis. (H) Fold changes were analyzed by setting the ratios of the phospho/total protein band intensities.