Figures & data
Figure 1 Immunocytochemical staining for vimentin and cytokeratin expression. (A) The cytoplasm of EuESCs was immunopositive for vimentin and immunonegative for cytokeratin. The nuclei were stained with hematoxylin (Magnification ×100). (B) The cytoplasm of EESCs was immunopositive for vimentin and immunonegative for cytokeratin. The nuclei were stained with hematoxylin (Magnification ×100).
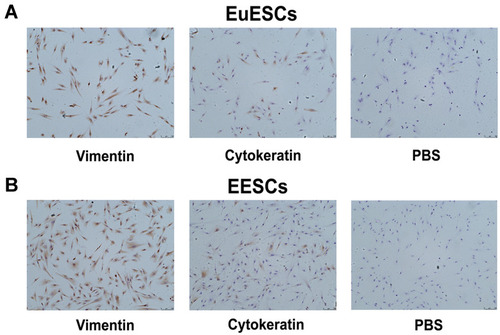
Table 1 The Cytotoxic Results of Quercetin on EuESCs
Table 2 The Cytotoxic Results of Quercetin on EESCs
Figure 2 Quercetin shows the cytotoxic effect on the viability of EuESCs and EESCs in vitro. (A) EuESCs were exposed to quercetin with various concentrations (0, 20, 50, 100, and 200 μM) for 24, 48 and 72 h. (B) EESCs were exposed to quercetin with various concentrations (0, 50, 100, 150, and 200 μM) for 24, 48 and 72 h. Cell viability was measured by CCK-8 assay. Data were presented as mean ± SD; *P <0.05 vs 0 μM group. Each experiment was performed three times.
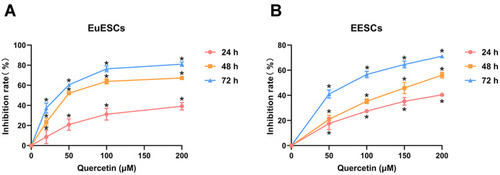
Figure 3 Quercetin inhibits the proliferation of EuESCs and EESCs in vitro. (A) Representative images for BrdU assay on EuESCs under a microscopy (Magnification ×100) after treatment with increasing concentrations of quercetin (0, 20, 40, and 80 μM) for 72 h. The bar graphs represented the BrdU positive rate of EuESCs. (B) Representative images for BrdU assay on EESCs under a microscopy (Magnification ×100) after treatment with increasing concentrations of quercetin (0, 40, 80, and 160 μM) for 72 h. The bar graphs represented the BrdU positive rate of EESCs. (C) The bar graph represented the ratio of BrdU positive rate between quercetin treatment group (40 or 80 μM) and control group (0 μM). Data were presented as mean ± SD; *P <0.05 vs 0 μM group; #P <0.05 vs EuESCs group. Each experiment was performed three times.
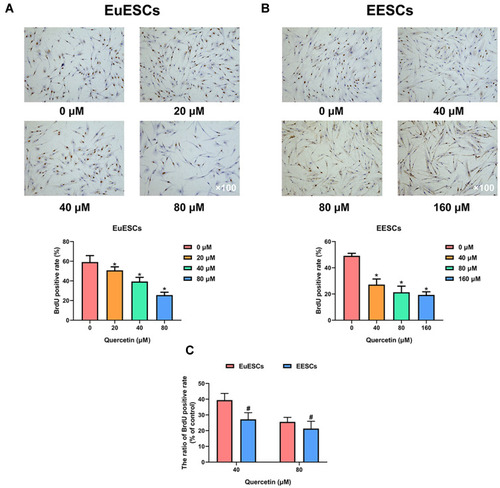
Figure 4 Quercetin inhibits the migration of EuESCs and EESCs in vitro. (A) EuESCs were exposed to increasing concentrations of quercetin (0, 20, 40, and 80 μM) for 72 h prior to the experiment. Representative images for cell scratch assay on EuESCs under a microscopy (Magnification ×100) at 0, 12 and 24 h. The bar graphs represented the cell migration rate of EuESCs. (B) EESCs were exposed to increasing concentrations of quercetin (0, 40, 80, and 160 μM) for 72 h prior to the experiment. Representative images for cell scratch assay on EESCs under a microscopy (Magnification ×100) at 0, 12 and 24 h. The bar graphs represented the cell migration rate of EESCs. (C) The bar graph represented the ratio of cell migration rate between quercetin treatment group (40 or 80 μM) and control group (0 μM). Data were presented as mean ± SD; *P <0.05 vs 0 μM group; #P <0.05 vs EuESCs group. Each experiment was performed three times.
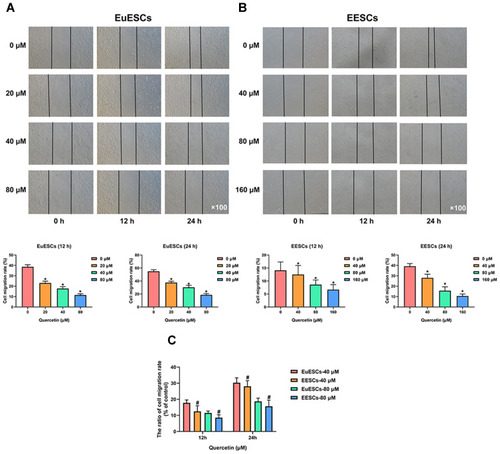
Figure 5 Quercetin inhibits the invasion of EuESCs and EESCs in vitro. (A) EuESCs were exposed to increasing concentrations of quercetin (0, 20, 40, and 80 μM) for 72 h prior to the experiment. Representative images for transwell invasion assay on EuESCs under a microscopy (Magnification ×100) at 24 h. The bar graphs represented the invaded cell numbers of EuESCs. (B) EESCs were exposed to increasing concentrations of quercetin (0, 40, 80, and 160 μM) for 72 h prior to the experiment. Representative images for transwell invasion assay on EESCs under a microscopy (Magnification ×100) at 24 h. The bar graphs represented the invaded cell numbers of EESCs. (C) The bar graph represented the ratio of invaded cell numbers between quercetin treatment group (40 or 80 μM) and control group (0 μM). Data were presented as mean ± SD; *P <0.05 vs 0 μM group; #P <0.05 vs EuESCs group. Each experiment was performed three times.
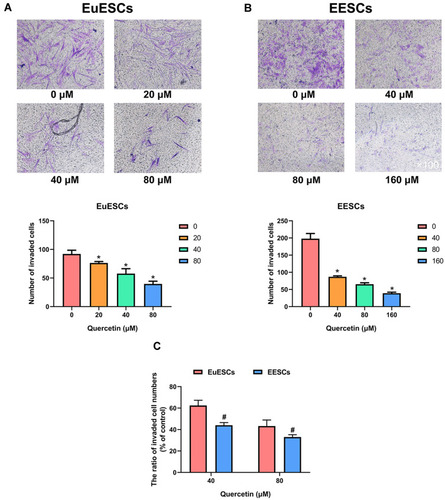
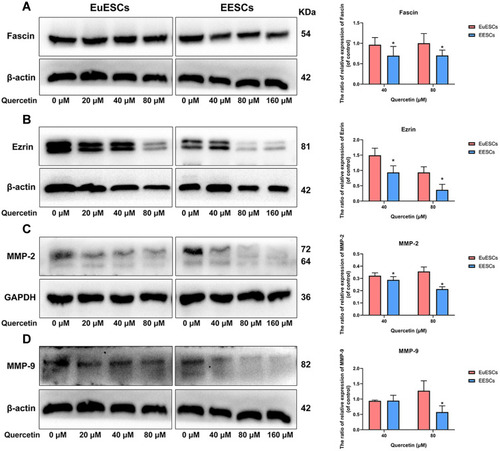
Figure 6 Quercetin downregulates the expression of migration- and invasion-related proteins in EuESCs and EESCs. (A, B) Western blot for the detection of cell migration markers (Fascin and Ezrin) in EuESCs and EESCs after treatment of different concentrations of quercetin (EuESCs: 0, 20, 40, and 80 μM; EESCs: 0, 40, 80, 160 μM) for 72 h. The bar graphs represented the ratios of Fascin and Ezrin relative expressions between quercetin treatment group (40 or 80 μM) and control group (0 μM). (C, D) Western blot for the detection of cell invasion markers (MMP-2 and MMP-9) in EuESCs and EESCs after treatment of different concentrations of quercetin (EuESCs: 0, 20, 40, and 80 μM; EESCs: 0, 40, 80, 160 μM) for 72 h. The bar graphs represented the ratios of MMP-2 and MMP-9 relative expressions between quercetin treatment group (40 or 80 μM) and control group (0 μM). Data were presented as mean ± SD; *P <0.05 vs EuESCs group. Each experiment was performed three times. Data were presented as mean ± SD; *P <0.05 vs EuESCs group. Each experiment was performed three times.