Figures & data
Figure 1 Effect of 4-FBS 20 mg/kg on tail flick latency time at different time-points. BALB/c mice (n=6/group) were used. The graph shows antinociceptive activity of 4-FBS 20 mg/kg p.o. in the tail-flick latency time. One way ANOVA followed by Dunnett’s test shows significance difference between at 30, 60, 90 and 120 min between 4-FBS vs. saline vehicle control, *p<0.05, **p<0.01, ***p<0.001.
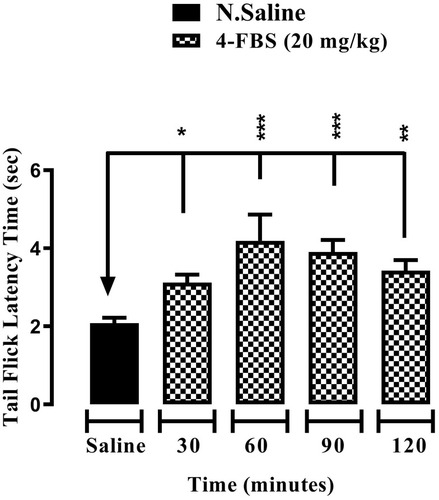
Figure 2 Effect of 4-FBS 20 mg/kg on tail flick latency time at different time-points. BALB/c mice (n=6/group) were used. The graph shows the antinociceptive activity of 4-FBS 40 mg/kg p.o. in tail-flick latency time. One way ANOVA followed by Dunnett’s test shows significance difference at 30, 60 and 90 except 120 min between 4-FBS vs. saline vehicle control, *p<0.05, **p<0.01, ***p<0.001.
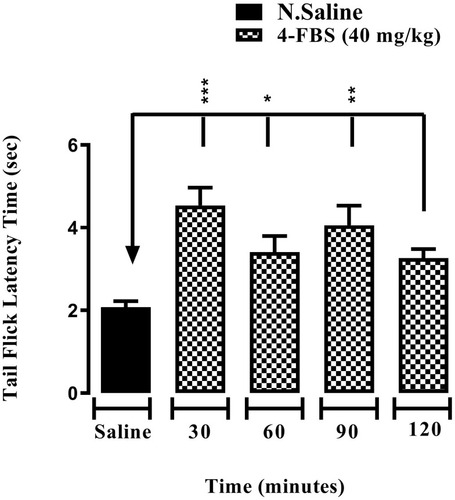
Figure 3 Shows partial reversal by ondansetron, 1mg/kg in tail flick latency protocol. Pain threshold was observed in 4-FBS 20mg/kg treated mice but it was statistically non-significant when compared with the saline vehicle control group.
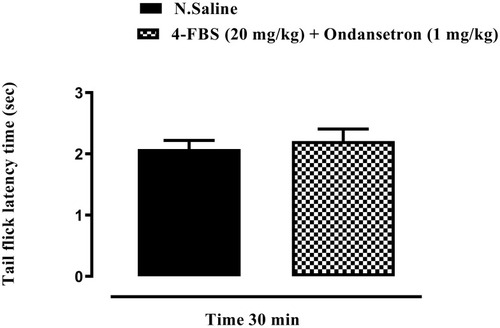
Figure 4 Shows that naloxone, 1mg/kg shows partial reversal of analgesia in tail flick latency protocol. Pain threshold was observed in 4-FBS at 20mg/kg treated mice, which was statistically non-significant when compared with the saline vehicle control group.
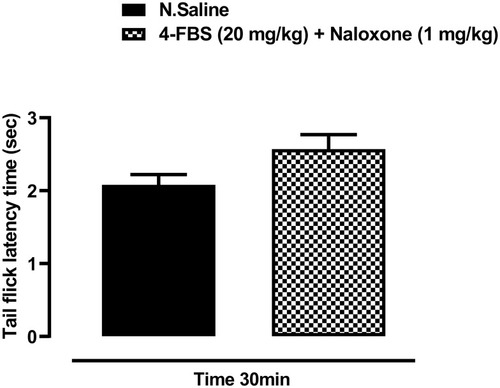
Figure 5 Effect of 4-FBS 20 and 40mg/kg on tail flick latency time at different time-points. BALB/c mice (n=6/group) were used. 4-FBS at 20 and 40mg/kg shows significant antihyperalgesic activity in the mouse tail-flick latency time. One way ANOVA followed by Dunnett’s test shows significance difference between STZ control and 4-FBS 20mg +STZ group at all-time intervals except for 120 min while 4-FBS 40mg +STZ group at all-time. *p<0.05, **p<0.01, ***p<0.001.
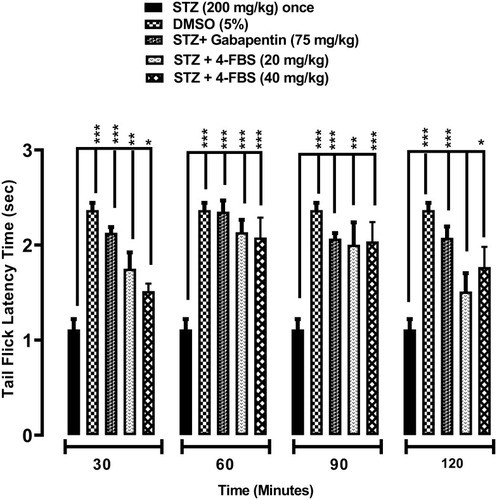
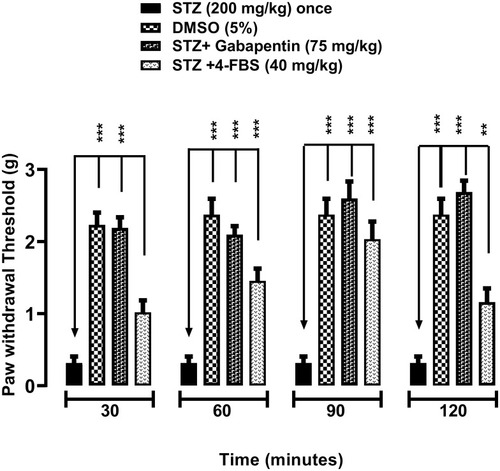
Figure 6 Effect of 4-FBS 20 mg/kg on paw withdrawal threshold time at different time-points. BALB/c mice (n=6/group) were used. 4-FBS at 20 mg/kg shows significant antiallodynic activity in the paw withdrawal threshold. One way ANOVA followed by Dunnett’s test shows significance difference between STZ control and 4-FBS 20mg +STZ group at all-time intervals except for 120 min. *p<0.05, **p<0.01, ***p<0.001.
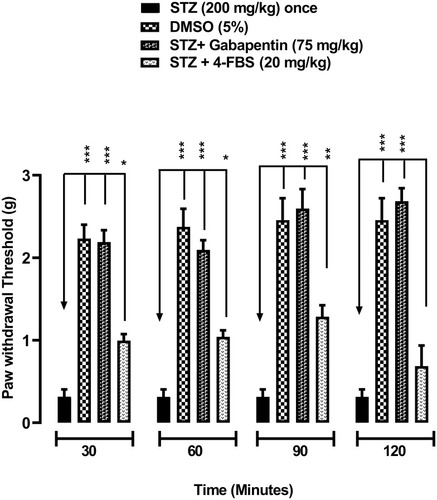
Figure 7 Effect of 4-FBS 40 mg/kg on paw withdrawal threshold time at different time-points. BALB/c mice (n=6/group) were used. 4-FBS at 40 mg/kg shows significant antiallodynic activity in the paw withdrawal threshold (n=6). One way ANOVA followed by Dunnett’s test shows significance difference between STZ control and 4-FBS 20mg +STZ group at all-time intervals except for 30 min. *p<0.05, **p<0.01, ***p<0.001.