Figures & data
Table 1 Patients’ Baseline Demographic and Clinical Characters
Table 2 Patients’ Response in Different Groups
Table 3 Multivariate Analysis for the Factors Associated with ORR
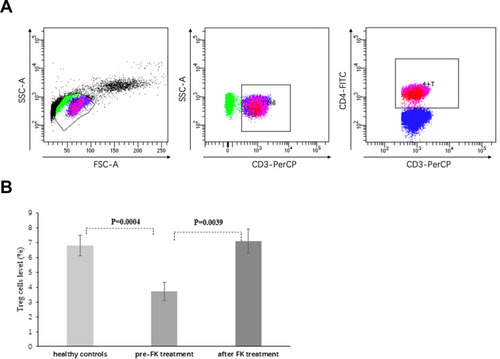
Figure 1 Regulatory T cells in peripheral blood before and after FK. (A) Total events of 50,000 were gated based on FSC and SSC characteristics, and dot plots for Treg cells were gated on CD4+ cells. Treg cells were defined as CD4+CD25+foxP3+ co-expression and expressed as a percentage of the total CD4+ T population. (B) The expression of Treg cells from 31 patients who achieved at least PR was tested before and 6 months after FK treatment. Eight age- and sex-matched normal volunteers were used as controls. Levels of Treg cells pre-FK were much lower compared to healthy controls, but increased significantly after FK treatment. FSC, forward-scatter characteristics; SSC, side-scatter characteristics; Treg cells, T regular cells; FK, tacrolimus; PR, partial response.