Figures & data
Figure 1 HTFs were successfully isolated.
Notes: (A) The morphology of HTFs and corneal epithelium cells was observed under a microscope. (B) The expression of vimentin and keratin in HTFs or cornea were investigated by immunofluorescence staining.
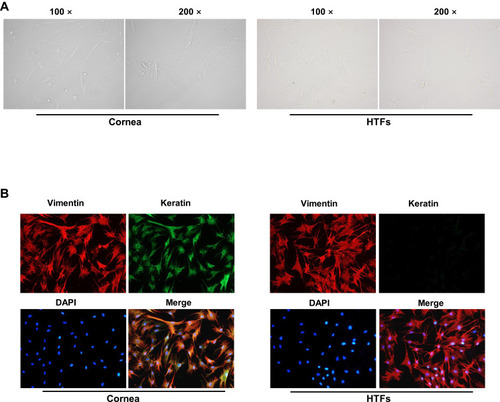
Figure 2 DHA significantly reversed TGF-β-induced proliferation in HTFs.
Notes: HTFs were treated with 10 ng/mL TGF-β for 24, 48 or 72 h. Then, (A) the protein expressions of α-SMA, collagen I and survivin in HTFs were detected by Western blot. (B–D) The relative expressions of α-SMA, collagen I and survivin were quantified by normalizing to β-actin. (E) The viability of HTFs was detected by CCK-8 assay. (F) HTFs were treated with 20, 40, 80 or 120 μM DHA for 72 h. Then, the viability of HTFs was measured by CCK-8 assay. (G) HTFs were treated with 10 ng/mL TGF-β, 10 ng/mL TGF-β + 40 μM DHA or 10 ng/mL TGF-β + 80 μM DHA for 72 h. Then, the cell viability was examined by CCK-8 assay. (H) HTFs were treated with 10 ng/mL TGF-β, 80 μM DHA or 10 ng/mL TGF-β + 80 μM DHA for 72 h. Then, the proliferation of HTFs was detected by immunofluorescence staining. Red fluorescence indicates Ki-67. Blue fluorescence indicates DAPI. (I) The positive rate of Ki-67 staining was calculated. *P<0.05, **P<0.01 compared to control. ##P<0.01 compared to TGF-β.
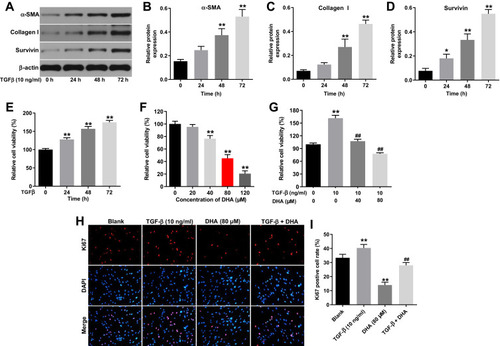
Figure 3 DHA inhibited TGF-β-induced fibrosis in HTFs via inducing autophagy.
Notes: (A) The location of LC3 was explored by immunofluorescence staining. Green fluorescence indicates LC3. Blue fluorescence indicates DAPI. (B) Relative level of LC3 was calculated. (C) The protein expressions of α-SMA, collagen I, Survivin, Beclin-1 and ATG5 in HTFs were detected by Western blot. (D–H) The relative expressions of α-SMA, collagen I, Survivin, Beclin-1 and ATG5 were quantified by normalizing to β-actin. *P<0.05, **P<0.01 compared to control. ##P<0.01 compared to TGF-β. ^^P<0.01 compared to TGF-β + DHA.
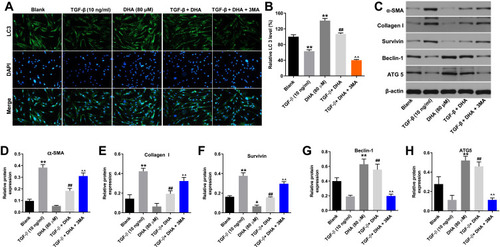
Figure 4 Autophagy inhibitor partially reversed DHA-induced oxidative stress in TGF-β-treated HTFs.
Notes: (A and B) The ROS level of HTFs was detected by flow cytometry. (C) The level of SOD in supernatants of HTFs was detected by ELISA. (D) The level of GSH in supernatants of HTFs was detected by ELISA. (E) The level of MDA in supernatants of HTFs was detected by ELISA. **P<0.01 compared to control. #P<0.05, ##P<0.01 compared to TGF-β. ^^P<0.01 compared to TGF-β + DHA.
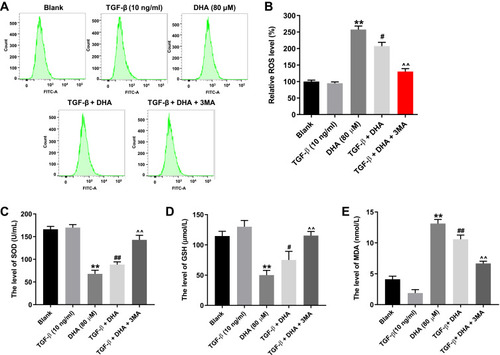
Figure 5 DHA-induced apoptosis in TGF-β-treated HTFs was partially reversed by 3-MA.
Notes: (A and B) The apoptosis of HTFs was detected by flow cytometry. (C) The protein expressions of Bax and cleaved caspase 3 in HTFs were detected by Western blot. (D and E) The relative expressions of Bax and cleaved caspase 3 were quantified by normalizing to β-actin. **P<0.01 compared to control. ##P<0.01 compared to TGF-β. ^^P<0.01 compared to TGF-β + DHA.
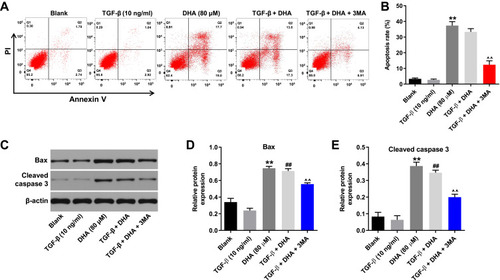
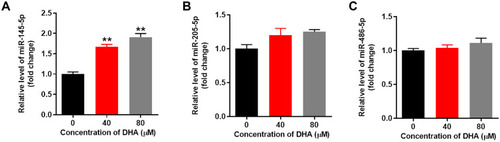
Figure 6 DHA notably upregulated the expression of miR-145-5p in HTFs.
Notes: HTFs were treated with 40 or 80 μM DHA for 72 h. Then, (A) the expression of miR-145-5p in HTFs was detected by RT-qPCR. (B) The expression of miR-205-5p in HTFs was detected by RT-qPCR. (C) The expression of miR-486-5p in HTFs was detected by RT-qPCR. **P<0.01 compared to control.