Figures & data
Figure 1 Schematic diagram illustrating the major steps of the experiment. The experimental rats were exposed to the CUS for 14 consecutive days. Meanwhile, different doses (50, 100, and 200 mg/kg/day, respectively) of VOZB were administered for 14 days.
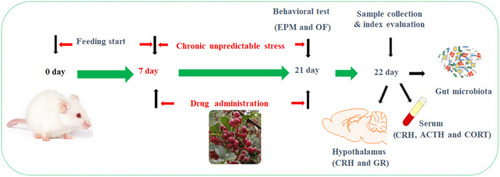
Table 1 Chronic Unpredictable Stress Experimental Schedule
Figure 2 The VOZB alleviated the CUS-induced anxiety behavior in the elevated plus maze (EPM) and open field (OF) tests. Ratio of open-arm entries (A) and ratio of open-arm time (B) in the EPM test were evaluated, as well as the entries into central area (C) and accumulative time spent in central area (D) in the OF test. Data obtained from the EPM and OF test was in accordance with normal distribution and analyzed by one-way ANOVA followed by Fisher’s LSD test. Data were expressed as the mean ± SD (n = 10), *p<0.05 and **p<0.01 vs the model group.
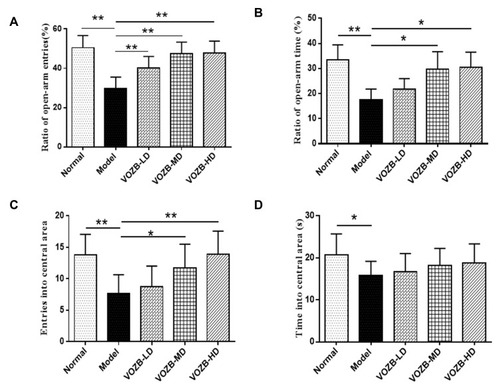
Figure 3 The VOZB regulated the protein expressions of CRH and GR in the hypothalamus. Representative photomicrographs and AOD values of CRH (A) and GR (B) in the paraventricular nucleus were shown respectively. The red arrows were used to mark the CRH positive cells. Data obtained from the EPM and OF test was in accordance with normal distribution and analyzed by one‑way ANOVA followed by Fisher’s LSD test. The AOD values of CRH and GR expressions in the hypothalamus were in accordance with normal distribution and analyzed by one‑way ANOVA followed by Fisher’s LSD test. Data were expressed as mean ± SD (n = 5), *p<0.05 vs the model group.
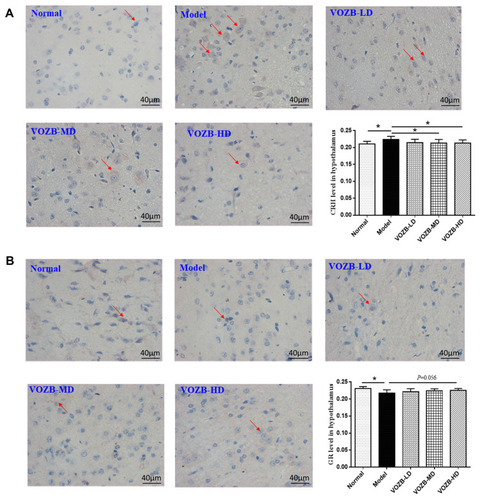
Figure 4 The VOZB improved the mRNA levels of CRH and GR in the hypothalamus. Levels of CRH mRNA (A) and GR mRNA (B) were respectively determined by RT-qPCR. The levels of CRH mRNA and GR mRNA in the hypothalamus were in accordance with normal distribution and analyzed by one‑way ANOVA followed by Fisher’s LSD test. Data were expressed as mean ± SD (n = 5), **p<0.01 vs the model group.
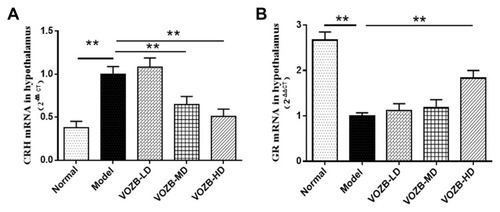
Figure 5 The VOZB regulated the levels of CRH, ACTH and CORT in serum. Levels of CRH (A), ACTH (B) and CORT (C) were respectively determined by ELISA. The levels of hormones in serum were in accordance with normal distribution and analyzed by one‑way ANOVA followed by Fisher’s LSD test. Data were expressed as mean ± SD (n = 10), *p<0.05 and **p<0.01 vs the model group.
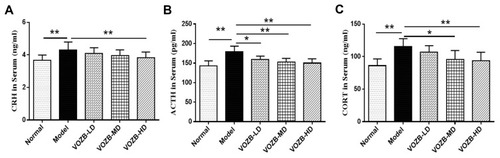
Figure 6 The VOZB affected the diversity of gut microbiota. The α diversity analysis of gut microbiota includes Sobs index (A), Chao index (B), Shannon index (C) and Simpson index (D). Sobs and Chao are community richness indexes, Shannon and Simpson were community diversity indexes. The β diversity of gut microbiota were also evaluated by PCoA (E) and NMDS (F). The distance between the different colored samples represents the similarity of gut microbiota, and a closer distance indicates higher similarity. The α diversity indexes (Sobs, Chao, Shannon, and Simpson) were in accordance with normal distribution and analyzed by one‑way ANOVA followed by Fisher’s LSD test. PCoA and NMDS were conducted according to weighted UniFrac distance metrics. All data were analyzed at genus level and the values were expressed as mean ± SD (n = 8), *p<0.05 and **p<0.01 vs the model group.
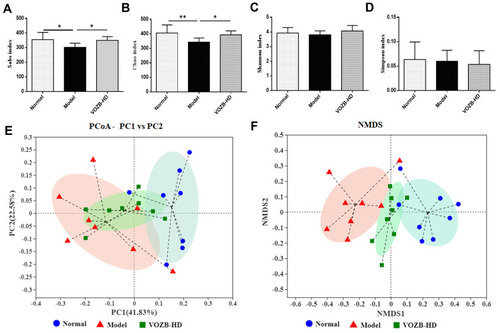
Figure 7 The VOZB treatment restored the dysbiosis of gut microbiota. (A) The change of OTUs were identified. (B) The composition profiles of gut microbiota were analyzed at phylum level. (C) The dominant phyla were compared between the different treatment groups. (D) The composition profiles of gut microbiota were further analyzed at family level. (E) The dominant genera were also compared between the different treatment groups. (F) The correlation of α diversity indexes (Sobs and Chao) and the HPA axis hormones in serum were analyzed by Pearson correlation test. The relative abundance of dominant communities at the phylum and family level was not in accordance with normal distribution and compared using Kruskal–Wallis test (a nonparametric test). The relative abundance of gut microbiota on different taxonomic levels was expressed as mean ± SD (n = 8), *p<0.05 and **p<0.01 vs the model group.
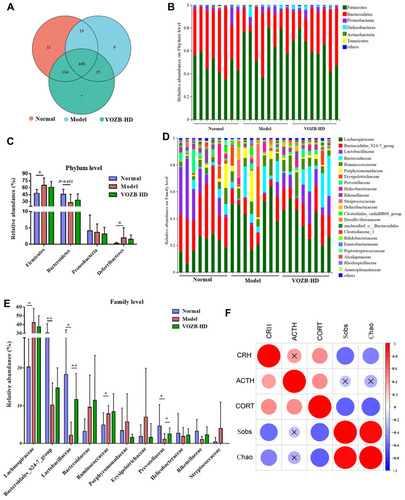
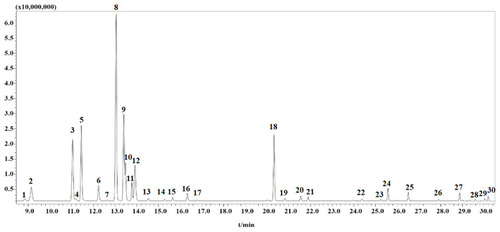
Table 2 Composition Analysis of the Volatile Oil of Z. bungeanum
Figure 8 Composition analysis of the VOZB. A total of 30 peaks were detected by GC‑MS.