
Figures & data
Figure 1 Study design and patient population.
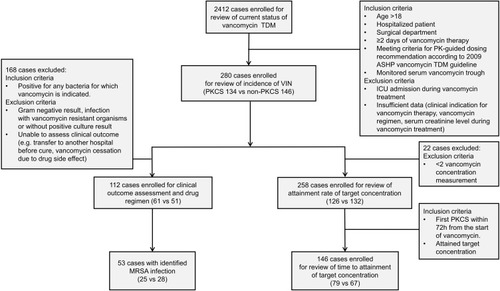
Table 1 Characteristics and Vancomycin Trough Concentration in Patients Who Underwent Vancomycin Therapeutic Drug Monitoring
Table 2 Characteristics of the Patients Enrolled for VIN Assessment
Table 3 Logistic Regression Analysis for Vancomycin Induced Nephrotoxicity
Table 4 Target Trough Attainment and Baseline Characteristics of Enrolled Patient
Table 5 Logistic Regression Analysis for Target Trough Attainment
Figure 2 Cumulative percentage of target trough attainment by time. Percentage of the patients who attained target trough was determined at three time periods (<3 days, 3–<5days, and ≥5days).
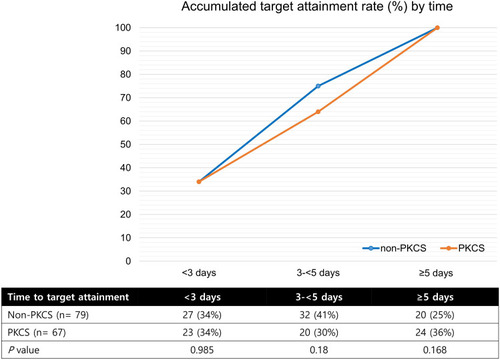
Table 6 Characteristics of Patients Enrolled for Clinical Outcome Assessment
Table 7 Logistic Regression Analysis for Treatment Failure Rate and Development of VIN in Patients with Positive Culture Result
Table 8 Clinical Outcome Analysis of Patients with MRSA Infection
Table 9 Comparison of Duration of Vancomycin Therapy Between Groups with or without the Possible Cause of Longer Duration of Therapy