Figures & data
Table 1 The Chemical Compounds and ADME Parameters of DBD
Figure 1 Venn diagram of common targets in DBD and MCC.
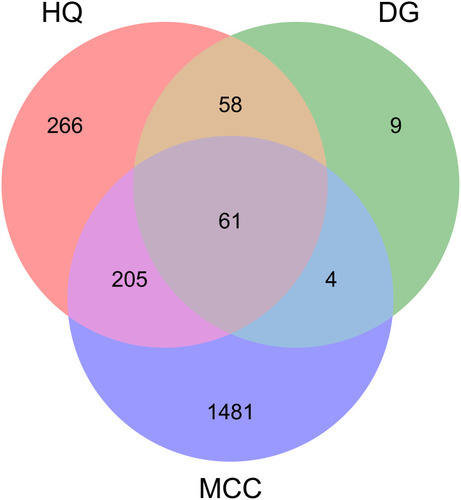
Table 2 The Topological Parameter Analysis of Top 13 Compounds in DBD
Table 3 Parameters of the Top 30 Genes in the PPI Network
Figure 2 DBD-compound-target-MCC network. All nodes were visualized in degree value, the larger the node, the darker the color and the higher the degree value. In this network, the red diamonds represent candidate targets of DBD against MCC, the orange and claybank octagons represent active compounds in HQ and DG, the green ellipse represent disease, while the remaining golden squares represent HQ and DG.
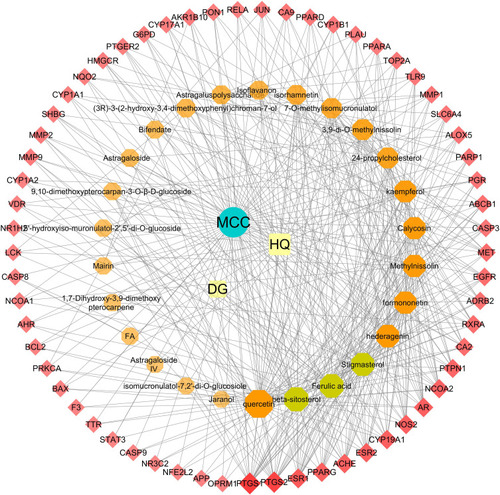
Figure 3 The construction of protein-protein interaction network. (A) Protein-Protein interaction network. Edges represent protein-protein interactions, edge thickness indicates the strength of data support, the larger the node, the higher the degree value. Golden circles represent the targets that interact with CASP3. (B) Common Targets-bar plot diagram. X-axis represents the number of nodes connected and Y-axis represents the target gene symbol.
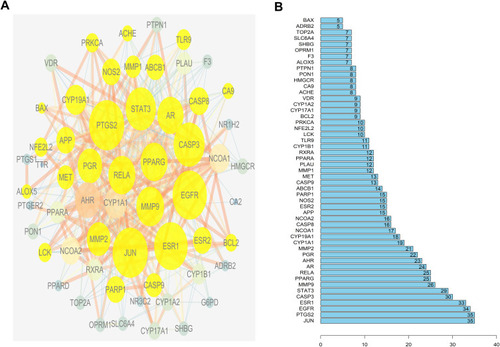
Figure 4 GO enrichment analysis. Different colors represent different clusters. (A) Terms of enriched biological processes on common targets. X-axis represents the percentage of the target genes versus the background genes in each term, Y-axis represents the name of biological processes, the red **Represents the number of enriched target genes. (B) Percentage of each cluster. The name of each term represents the leading term based on the highest significance value in each cluster.
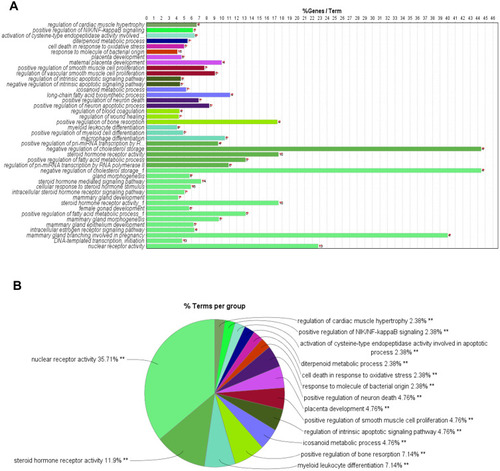
Figure 5 KEGG pathway enrichment dot-plot diagram. The top 30 signaling pathways regulated by DBD. X-axis represents the ratio of enriched target genes/background genes. Y-axis represents the term of enriched pathways. The sizes of the dots indicate the number of target genes in a certain pathway, and the colors of the dots reflect the different values of p.adjust.
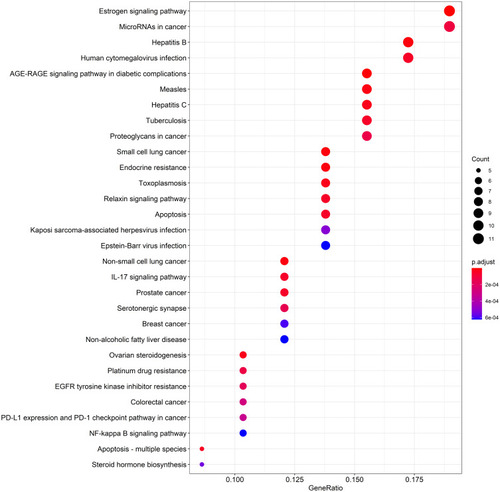
Figure 6 DBD inhibited the growth of metastatic tumor. (A) Growth curve of metastatic tumor. (B) Metastatic tumor weight. All data was presented as mean ± standard deviation, ***p<0.001, ****p<0.0001.
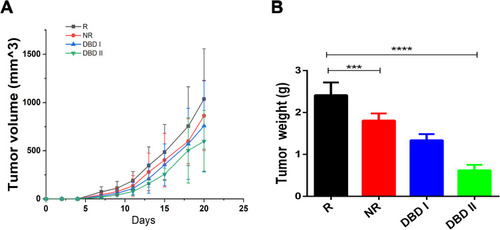
Figure 7 Histopathological examination. HE staining of metastatic tumor. Representative image for HE staining of tumor sections from groups R, NR, DBD I and DBD II at 400x magnification power.
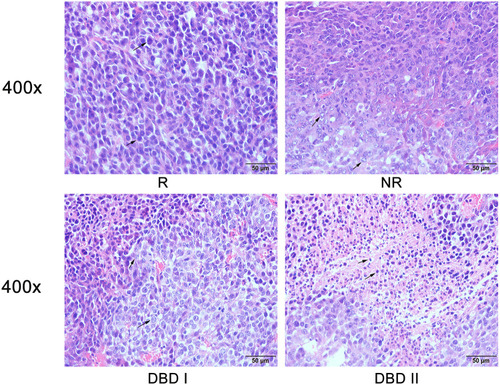
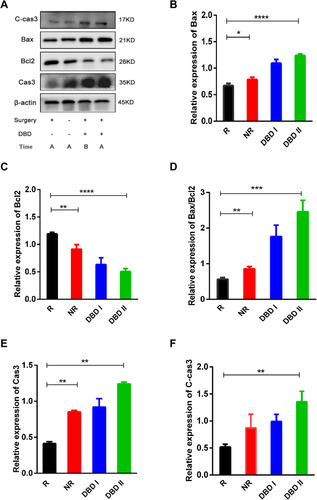
Figure 8 DBD inhibited the growth of metastatic tumor through inducing cell apoptosis. (A) The effect of DBD on metastatic tumor was analyzed by Western blot. Figures (B and C, E and F) showed the expression of Bax, Bcl2, Cas3 and C-cas3 in metastatic tumor among R, NR, DBD I and DBD II groups, with β-actin as internal control. (D) Western blot analysis showed the ratio of Bax/Bcl2 in Metastatic tumor among groups R, NR, DBD I and DBD II. All data was presented as mean ± standard deviation. (*p<0.05, **p<0.01, ***p<0.001, ****p<0.0001).