
Figures & data
Table 1 The Independent Variables and the Characterization Data of the Factorial Design-Derived NFX-Loaded PLGA NPs
Table 2 The Composition and Characterization Data of the Investigated NFX-Loaded PLGA NP-Laden Hydrogels
Table 3 The Factorial Design Analysis Data of the Responses of NFX-Loaded PLGA NPs
Figure 1 (A) In vitro release profiles of NFX from NFX-loaded PLGA NPs and NFX suspension in simulated tear fluid (pH 7.4), mean ± S.D., n = 3. (B) Ex vivo goat corneal permeation profiles of NFX from NFX-loaded PLGA NPs and NFX suspension in simulated tear fluid (pH 7.4), mean ± S.D., n = 3.
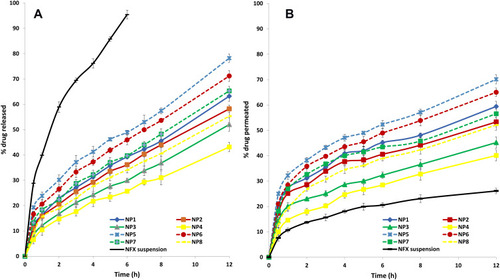
Figure 2 Transmission electron micrographs of NP2 (A) and NP6 (B).
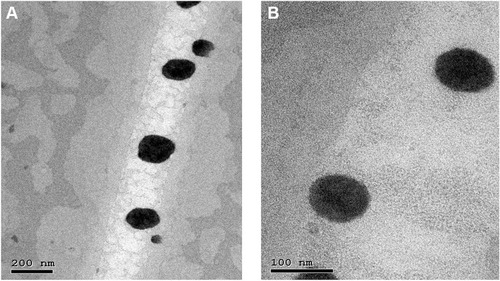
Figure 3 (A) FT-IR spectra of NFX (1), ester terminated PLGA (2), NFX-ester terminated PLGA physical mixture (3) and lyophilized NFX-loaded NP2 (4). (B) FT-IR spectra of NFX (1), acid terminated PLGA (2), NFX-acid terminated PLGA physical mixture (3) and lyophilized NFX-loaded NP6 (4).
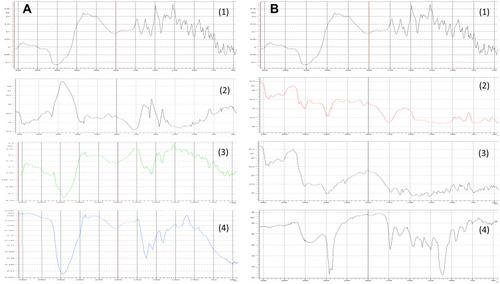
Figure 4 Thixotropic behavior of NFX-loaded PLGA NP-laden HPMC hydrogels (G1 (A), G2 (B), G3 (C) and G4 (D).
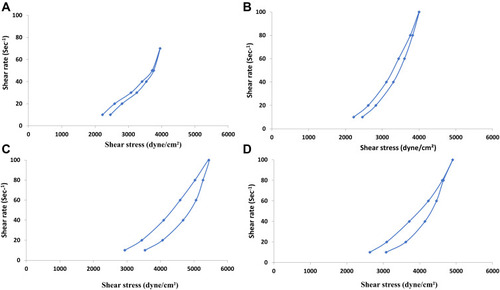
Figure 5 (A) In vitro release profiles of NFX from NFX-loaded PLGA NP-laden HPMC hydrogels in simulated tear fluid (pH 7.4), mean ± S.D., n = 3. (B) Ex vivo goat corneal permeation profiles of NFX from NFX-loaded PLGA NP-laden HPMC hydrogels in simulated tear fluid (pH 7.4), mean ± S.D., n = 3.
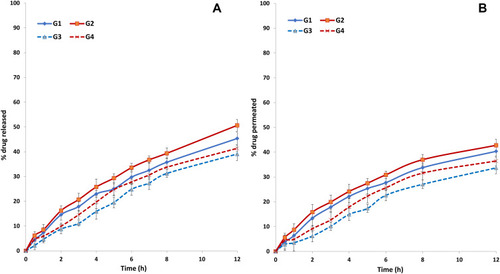
Table 4 Comparison of the Clinical and Histopathological Findings of the Excised Corneal Tissue Sections in the Investigated Groups
Figure 6 Conjunctival hyperemia and corneal edema in rabbits with Pseudomonas-induced keratitis pre- (A) and 10 days post- (B) non-treatment in the infected group (a) or treatment in drug suspension- (b), G3- (c), G4- (d) groups.

Figure 7 Histopathological changes observed, under two magnifications, in the sections of the excised corneal tissues in different groups [control (A), infected (B), drug suspension (C), G3 (D), G4 (E)]. The black arrow points to the epithelial layer, the green arrow shows the proliferating fibroblasts, and the red arrow refers to the polymorphonuclear inflammatory cells infiltrate. The stars denote the stromal collagen lamellar morphology (A), neovascularization (B), congested/dilated blood vessels (C–E).
![Figure 7 Histopathological changes observed, under two magnifications, in the sections of the excised corneal tissues in different groups [control (A), infected (B), drug suspension (C), G3 (D), G4 (E)]. The black arrow points to the epithelial layer, the green arrow shows the proliferating fibroblasts, and the red arrow refers to the polymorphonuclear inflammatory cells infiltrate. The stars denote the stromal collagen lamellar morphology (A), neovascularization (B), congested/dilated blood vessels (C–E).](/cms/asset/6bc40ace-ed7c-4996-90e0-4d4000727a67/dddt_a_12183993_f0007_c.jpg)