Figures & data
Table 1 Clinical Score Standard of Keratitis Infected with S. aureus
Figure 1 The flowchart demonstrates allocation to three groups, follow-up and investigations carried out at each time point.
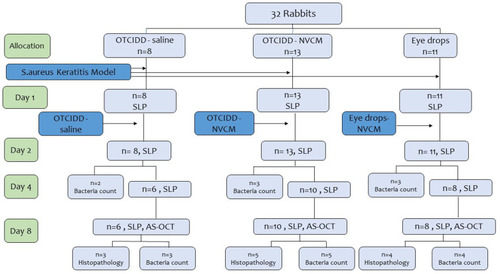
Figure 2 The ring part of the CTOIDD system model was fixed on the conjunctiva of a rabbit eye.
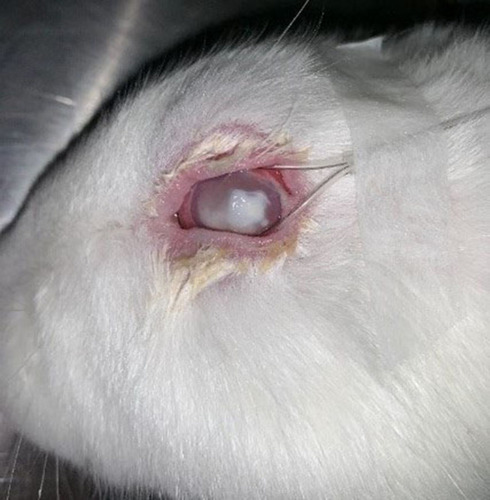
Table 2 Clinical Scores in Three Groups
Figure 3 Representative slit-lamp pictures of the CTOIDD-NVCM group (A–D), Eye drop group (E–H), CTOIDD-saline group (I–L). Pictures were taken on days one (A, E, I), two (B, F, J), four (C, G) and eight (D, H, L). Eyes in the CTOIDD-saline group presented a remarkable corneal edema and infiltration, conjunctival hyperemia and hypopyon. A typical corneal perforation with hyperemic iris incarceration on day six was observed in the CTOIDD-saline group (K). The eyes on day eight in the CTOIDD-NVCM and eye drop groups appeared less inflamed.
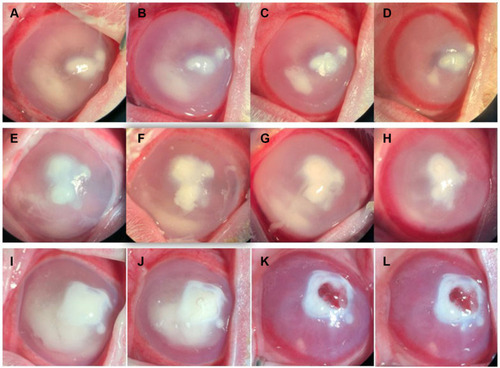
Figure 4 Clinical inflammation score changes in three groups (n=13 in CTOIDD-NVCM, n=11 in eye drop-NVCM, n=8 in CTOIDD-saline group on days one, two; n=10 in CTOIDD-NVCM group, n=8 in eye drop-NVCM group, n=6 in CTOIDD-saline group on days four, six, eight). Values are given as the median (IQR).
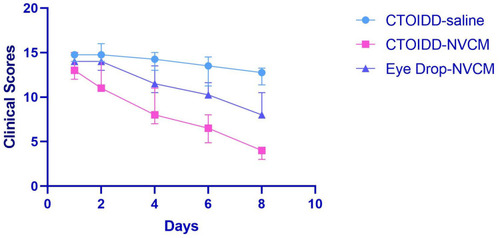
Figure 5 Comparison of inflammation scores in different days among the three groups. Kruskal–Wallis test was used to compare the difference with a posthoc test. Values are given as the median (IQR), *p<0.05, **p<0.01.
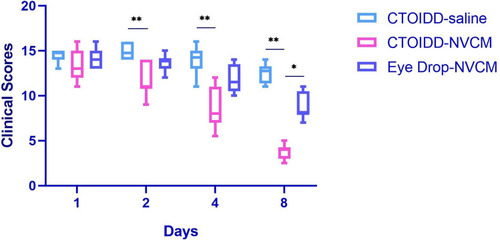
Figure 6 Representative pictures of AS-OCT examination in cornea. Cornea in healthy rabbit (A). Corneas in CTOIDD-NVCM group (B), eye drop group (C) and CTOIDD-saline group (D) on day eight, respectively.

Figure 7 Comparison of bacteria count in the three groups. One-way analysis of variance was used to compare the difference with a post hoc test. Values are given as mean ±SD, *p<0.05, **p<0.01.
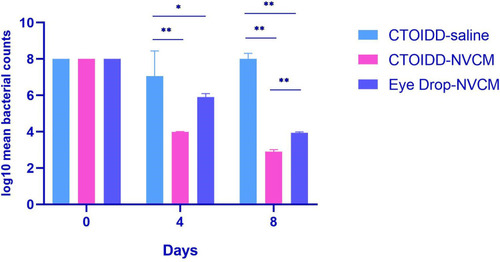
Figure 8 Representative pictures of histopathological section images of cornea (A–E), iris (F–I) and ciliary body (J–M) in healthy rabbits and three groups on day eight. Healthy cornea (A), cornea in CTOIDD-NVCM group (B), eye drop group (C, E), CTOIDD-saline group (D). Healthy iris (F), iris in CTOIDD-NVCM group (G), eye drop group (H), CTOIDD-saline group (I). Healthy ciliary body (J), ciliary body in CTOIDD-NVCM group (K), eye drop group (L), CTOIDD-saline group (M). (A–C) 20× magnification, scale bar 50 μm; (D, E) 10× magnification, scale bar 100 μm; (F–M) 20× magnification, scale bar 50 μm, H&E stain.
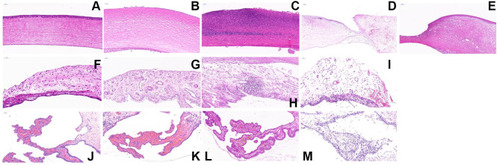
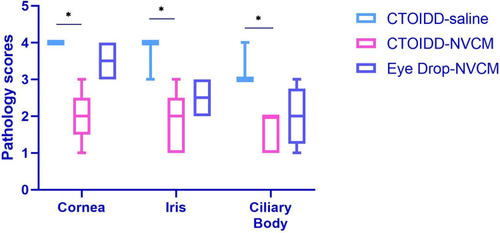
Table 3 Pathological Scores of Cornea, Iris and Ciliary Body in Three Groups
Figure 9 Comparison of pathology infiltration inflammation scores in three groups. Kruskal–Wallis test was used to compare the difference with a post hoc test. Values are given as the median (IQR), *p<0.05.