Figures & data
Table 1 List of Clinical Studies and Their Demographics Used for the Development and Verification of Propranolol-PBPK-Healthy Population Model
Table 2 List of Clinical Studies and Their Demographics Used for the Development and Verification of Propranolol- Cirrhosis PBPK Model
Table 3 Input Parameters Used for the Development of PBPK Model of Propranolol
Figure 1 General workflow of the development of propranolol PBPK model in healthy and cirrhotic populations.
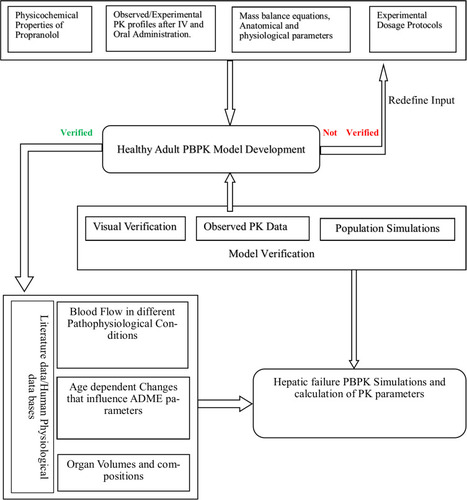
Table 4 Fractions of Physiological Changes, Incorporated in the Propranolol-Cirrhosis-PBPK Model
Table 5 Mean Observed and Predicted Values of Different Pharmacokinetic Parameters After Intravenous and Oral Administration of Propranolol Among Healthy and Their Ratios (Observed vs Predicted). Average Fold Error (AFE) and Root Mean Square Error (RMSE) of All Predictions of the Developed PBPK Model in Healthy Individuals
Figure 2 Comparison of observed and predicted systemic propranolol plasma concentration versus time profile in healthy subjects after IV dose of (A) 0.05 mg/kg,Citation65 (B) 0.1 mg/kg,Citation66 (C) 0.2 mg/kg,Citation27 (D) 1 mgCitation46 (E) 2.2 mgCitation26 (F) and (G) 10 mgCitation28,Citation47 respectively. Solid line (―) are indicating arithmetic mean, dash line (---------) minimum and maximum concentrations, dotted line (.............) 10th and 90th percentile.
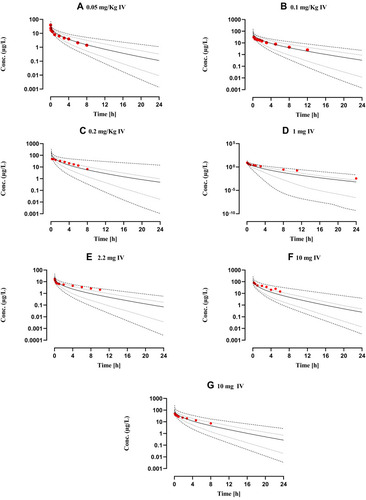
Figure 3 Comparison of observed and predicted systemic propranolol plasma concentration versus time profile in healthy subjects after oral dose of (A) 5 mg,Citation29 (B) 10 mg,Citation29 (C–F) 40 mg,Citation29,Citation30,Citation46,Citation48 (G–M) 80 mgCitation26,Citation31,Citation32,Citation49–Citation52 (N) and (O) 160 mgCitation67,Citation68 respectively. Solid line (―) are indicating arithmetic mean, dash line (---------) minimum and maximum concentrations, dotted line (.............) 10th and 90th percentile.
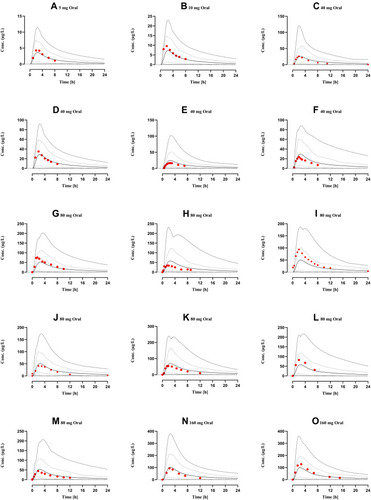
Table 6 Mean Observed and Predicted Values of Different Pharmacokinetic Parameters After Intravenous and Oral Administration of Propranolol Among Cirrhosis Populations and Their Ratios (Observed vs Predicted). Average Fold Error (AFE) and Root Mean Square Error (RMSE) of All Predictions of the Developed PBPK Model in Healthy Individuals
Figure 4 Comparison of observed and predicted systemic propranolol plasma concentration versus time profile in Cirrhosis population (CP-A–C) subjects after IV dose of (A) 1 mgCitation46 (B) 0.4 mg/kg,Citation35 an oral dose of (C) 40 mg,Citation46 (D) 80 mg,Citation69 (E) 80 mg twice daily (b.i.d)Citation63 and (F) 160 mgCitation62 respectively. Solid line (―) indicating Arithmetic mean, dash line (---------) minimum and maximum concentrations, dotted line (................) 10th and 90th percentile.
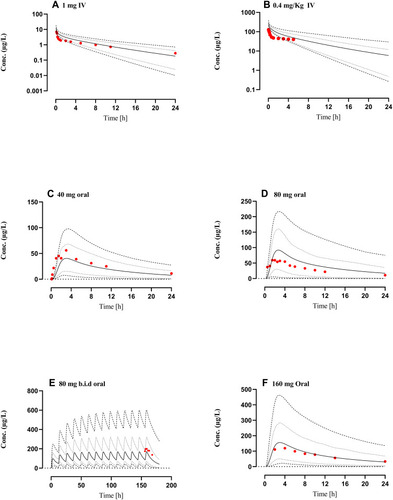
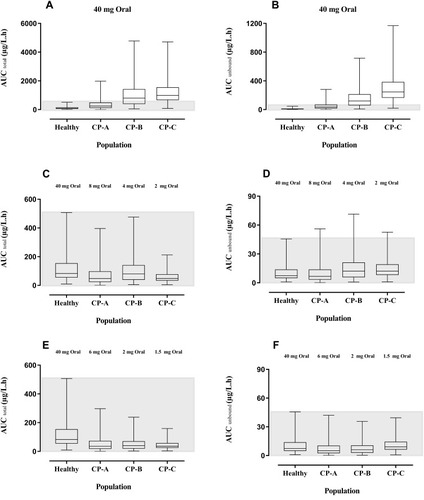
Figure 5 Box-Whisker plots compare the AUCtotal and AUCunbound after oral doses of propranolol among healthy, CP-A, CP-B, and CP-C populations. (A) AUCtotal after 40 mg oral dose of propranolol in healthy adults and CP-A–C populations. (B) AUCunbound after 40 mg oral dose of propranolol among healthy adults and CP-A–C populations. (C) AUC total up to 20%, 10%, and 5% reduction in oral doses of propranolol in CP-A, CP-B, and CP-C populations respectively as compared to 40 mg oral dose in the healthy population. (D) AUC unbound up to 20%, 10%, and 5% reduction in oral doses of propranolol in CP-A, CP-B, and CP-C populations respectively as compared to 40 mg oral dose in the healthy population. (E) AUC total after further 25%, 50%, and 25% reduction in oral doses of propranolol among CP-A, CP-B, and CP-C populations respectively (F) after further 25%, 50%, and 25% reduction in oral doses of propranolol among CP-A, CP-B, and CP-C populations respectively.