Figures & data
Figure 1 Fabricated 5FU-loaded gastrointestinal nitinol stents: (A) Si-PUFU stent (single-layer, base-coated only) and (B) Si-PUFU-PEVA stent (double-layer, both base- and top-coated); (C) Ba-PUFU stent (single-layer, base-coated only) and (D) Ba-PUFU-PEVA stent (double-layer, both base- and top-coated).
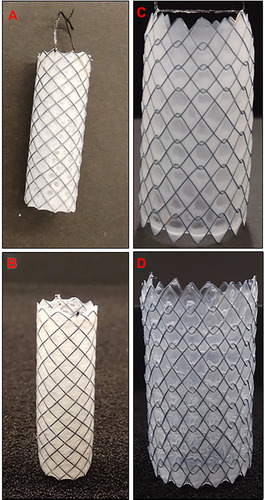
Table 1 Theoretical and Experimental Drug Loading Content for Dip-Coated Nitinol Stents (n = 6)
Figure 2 In vitro release profile of 5-fluorouracil (5-FU) from (A) Si-PUFU-PEVA stents over 161 days and (B) Ba-PUFU-PEVA stents over 30 days in phosphate buffer saline (10 mM, pH 7.4). Data represents n = 3, mean ± standard deviation.
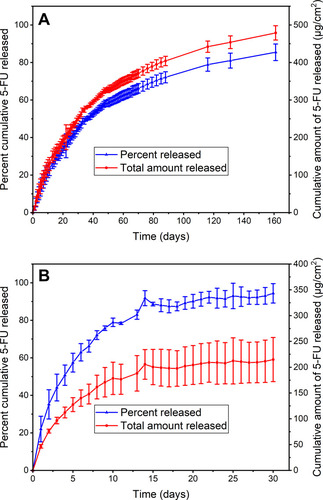
Figure 3 Amount of N,N-dimethylformamide (DMF) detected (by HPLC) per day over seven successive days after in vitro release from the Si-PUFU-PEVA or Ba-PUFU-PEVA stents in phosphate buffered saline (10 mM, pH 7.4). Three asterisks (***) reflect DMF amount below the HPLC method quantitation limit of 5 ppm. All values represent mean (n = 3) ± standard deviation.
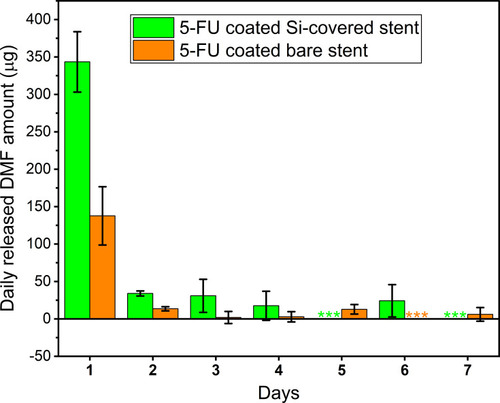
Figure 4 In vitro percentage cumulative 5-fluorouracil (5-FU) release curves from (A) Si-PUFU-PEVA stents over 14 days and (B) Ba-PUFU-PEVA stents over 13 days in phosphate buffered saline (10 mM, pH 7.4, 37 °C). Data for control (non-irradiated) and gamma-irradiated stents (n = 2 for all data points, mean ± standard deviation).
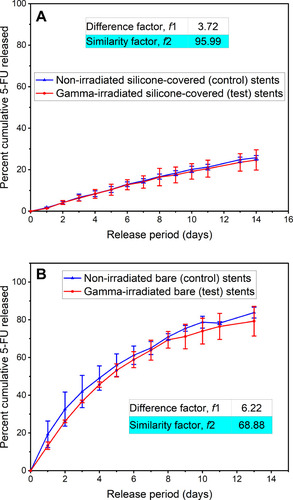
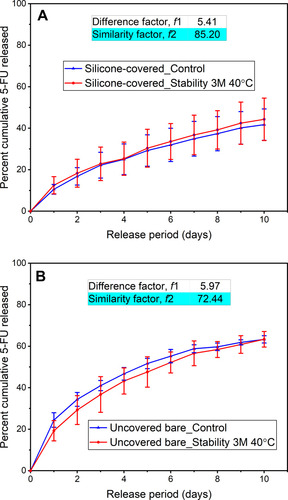
Figure 5 Cumulative percent of 5-fluorouracil (5-FU) released in vitro from the representative control and accelerated stability (40 °C and 75% relative humidity) test of the (A) Si-PUFU-PEVA and (B) Ba-PUFU-PEVA stents. Data from 3-month stability samples (n = 3 ± standard deviation). For drug release profiles to be similar, difference factor (f1) and similarity factor (f2) need to be ≤ 15 and ≥ 50 (50 to 100), respectively.