Figures & data
Figure 1 The mechanism of BSA NPs/siRNA preparation and anti-tumor effect. BSA NPs/siRNA were prepared by desolvation-crosslinking method. BSA NPs/siRNA could target survivin-siRNA into tumor tissues, and promote the cellular uptake of survivin-siRNA. The gene silencing effect of survivin-siRNA was significantly enhanced after loaded in BSA NPs.
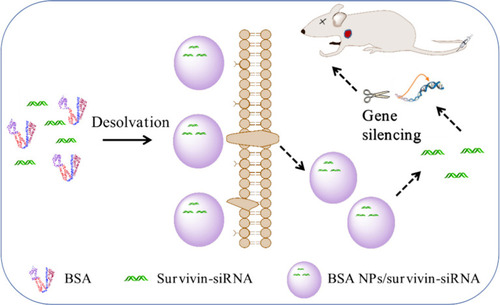
Table 1 The Experiments Designed by CCD-RSM
Figure 2 Diameter and PDI of BSA NPs prepared by different BSA concentrations (A), pH values (B), ethanol volume (C), speed of ethanol addition (D), speed of stirring rate (E), glutaraldehyde concentrations (F).
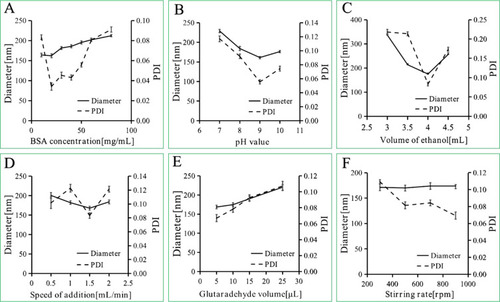
Figure 3 Response surface plots for diameter (A), PDI (B), zeta potential (C), and the plots indicated the interaction between X1 and X2. X1: BSA concentration (mg/mL), X2: pH value.
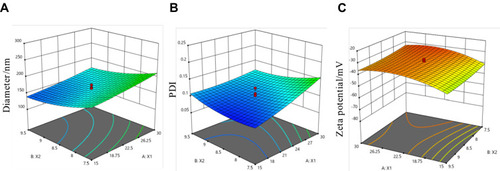
Figure 4 Characteristics of BSA NPs and BSA NPs/siRNA. (A) The schematic diagram, hydrodynamic diameter and zeta potential for BSA NPs and BSA NPs/siRNA preparation, (B) AFM images of BSA NPs/siRNA, and (C) TEM image of BSA NPs/siRNA.
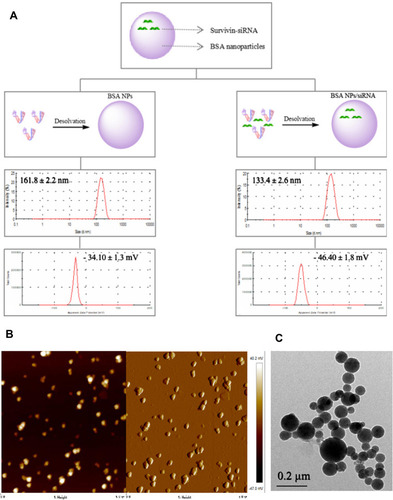
Figure 5 (A) Storage stability of BSA NPs at 4°C for 4 weeks, which was characterized by diameter and PDI of BSA NPs. (B) The release of survivin-siRNA from naked siRNA and BSA NPs/siRNA. (C) The Tyndall effect of water, BSA NPs and BSA NPs/siRNA was observed. (D) The degradation of naked siRNA and BSA NPs protected siRNA by RNase A, which were characterized by agarose gel retardation assay. The data were presented as the mean ± SD, n = 3.

Figure 6 Cellular uptake of BSA NPs/siRNA in MCF-7 cells. The cells were treated with PBS (Control), Naked Cy3-siRNA, BSA NPs/Cy3-siRNA and Lipo/Cy3-siRNA for 4h, respectively, and the fluorescence signals were recorded by confocal laser scanning microscopy (CLSM). The blue fluorescence represented cell nucleus dyed by Hoechst 33342. The bright red fluorescence represented the location of Cy3-labelled siRNA.
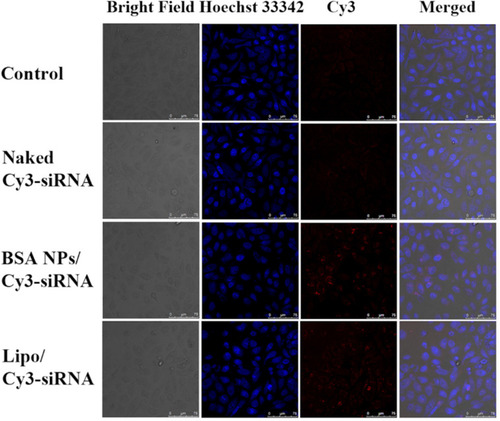
Figure 7 (A) Cytotoxicity assay of BSA NPs tested by MTT method. (B) Anti-proliferation effect of siRNA, Lipo/NC, BSA NPs/NC, Lipo/siRNA and BSA NPs/siRNA at different concentrations on MCF-7 cells. The data were presented as the mean ± SD, n = 3.
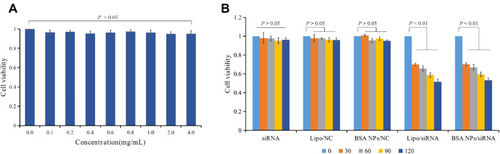
Figure 8 Gene silencing effect of BSA NPs/siRNA in vitro. (A) Survivin-mRNA level of the MCF-7 cells treated with naked siRNA, Lipo/NC, BSA NPs/NC, Lipo/siRNA and BSA NPs/siRNA. (B) Survivin protein level of the MCF-7 cells treated with naked siRNA, Lipo/NC, BSA NPs/NC, Lipo/siRNA and BSA NPs/siRNA. The data were presented as the mean ± SD, n = 3.
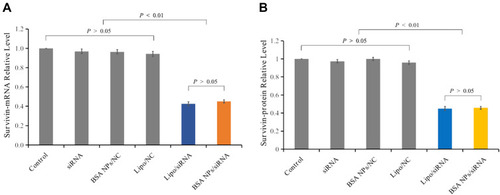
Figure 9 Fluorescent images of tumor-bearing nude mice injected with normal saline, Cy5-siRNA and BSA NPs/Cy5-siRNA at 1 h, 2 h, 4 h and 8 h.
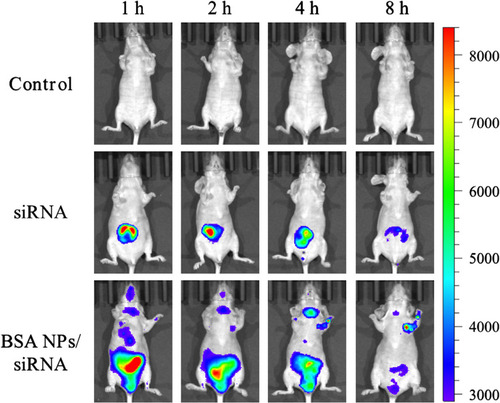
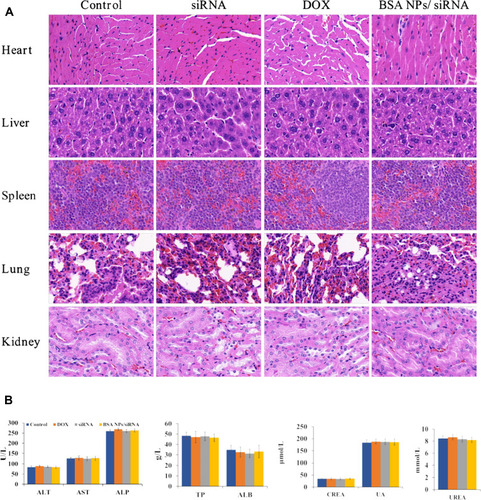
Figure 10 In vivo antitumor effect of BSA NPs/siRNA. (A) The tumor volume of control, naked siRNA, DOX and BSA NPs/siRNA measured every other day. (B) The tumor volumes of control, naked siRNA, DOX and BSA NPs/siRNA at the end of the observation. (C) Tumor images of control, naked siRNA, DOX and BSA NPs/siRNA ex vivo. (D) The H&E staining of tumors in control, naked siRNA, DOX and BSA NPs/siRNA groups (40×). The data were presented as the mean ± SD, n=6.
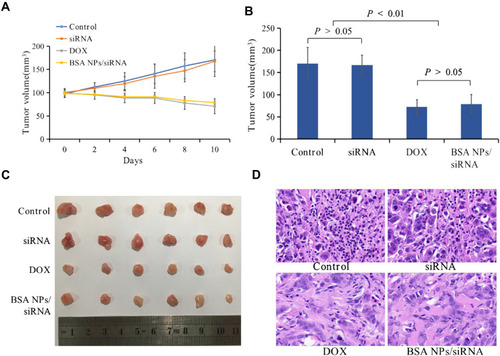
Table 2 Blood Panel Analysis
Figure 11 Biosafety of BSA NPs/siRNA. (A) H&E staining of the main organs (hearts, livers, spleens, lungs and kidneys) treated by NS (control), naked siRNA, DOX and BSA NPs/siRNA (40×). (B) Blood biochemistry indexes of NS (control), naked siRNA, DOX and BSA NPs/siRNA-treated groups. ALT, AST, ALP, TP and ALB indicated the function of liver; CREA, UA and UREA indicated the function of kidney. The data were presented as the mean ± SD, n=5.