Figures & data
Figure 1 CSMFCH component-target network. (A) Venn diagram: 137 components (green section), and 18 bioactive components filtered by two models relevant to ADME (blue section stands for the components of OB ≥ 30%, red section stands for DL ≥ 0.18). (B) CS component-target network, including 316 nodes and 714 edges. (C) MF component-target network, including 165 nodes and 373 edges. (D) Construction of CSMFCH component-target visual network, including 325 nodes and 835 edges. Turquoise node and orange node stand for CS and MF, respectively. Purple nodes and pink nodes stand for bioactive components from CS and MF, respectively. Yellow node stands for the common components from CS and MF. Blue nodes stand for targets.
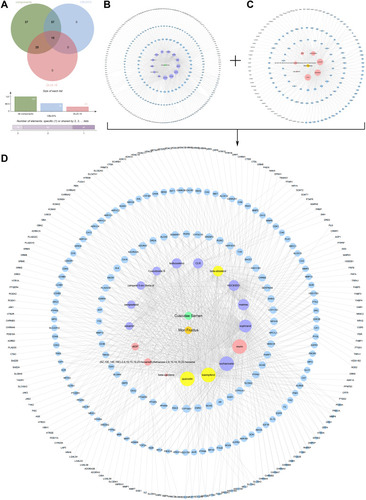
Table 1 Three Best-Scoring Terms of KEGG Pathway Analysis Applied to Each MCODE of the CSMFCH Component-Target Network
Figure 2 GO and KEGG pathway enrichment analyses of the CSMFCH component-target network (p-value ≤ 0.05). (A) The PPI network. (B) The clusters of PPI network. The colors indicate diverse clusters or binding site sets that are predicted by the MCODE algorithm. (C) The top 20 biological processes. (D) The top 20 cellular components. (E) The top 20 molecular functions. (F) The top 20 KEGG pathways. The bar plot and different colors show the enrichment scores [-log10 (P-value)] of the top 20 significant enrichments.
![Figure 2 GO and KEGG pathway enrichment analyses of the CSMFCH component-target network (p-value ≤ 0.05). (A) The PPI network. (B) The clusters of PPI network. The colors indicate diverse clusters or binding site sets that are predicted by the MCODE algorithm. (C) The top 20 biological processes. (D) The top 20 cellular components. (E) The top 20 molecular functions. (F) The top 20 KEGG pathways. The bar plot and different colors show the enrichment scores [-log10 (P-value)] of the top 20 significant enrichments.](/cms/asset/1f076101-2104-4ada-b34e-716c62e7b972/dddt_a_12184093_f0002_c.jpg)
Figure 3 OA-related targets. (A) Venn diagram: OA-related targets are 495, including 473 common targets between oligospermia and asthenozoospermia, and 31 targets from the search term “oligoasthenozoospermia”. (B) Venn diagram: the number of OA-related targets from the five different databases is 415, 78, 51, 36, and 30, respectively. The common target is androgen receptor (AR).
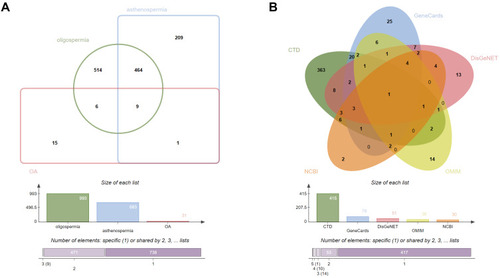
Table 2 Three Best-Scoring Terms of KEGG Pathway Analysis Applied to Each MCODE of the OA-Related Targets
Figure 4 GO and KEGG pathway enrichment analyses of the OA-related targets (p-value ≤ 0.05). (A) The PPI network. (B) The clusters of PPI network. The colors represent different clusters or sets of binding sites predicted by MCODE algorithm. (C) The top 20 biological processes. (D) The top 20 cellular components. (E) The top 20 molecular functions. (F) The top 20 KEGG pathways. The bar plot and different colors show the enrichment scores [-log10 (P-value)] of the top 20 significant enrichments.
![Figure 4 GO and KEGG pathway enrichment analyses of the OA-related targets (p-value ≤ 0.05). (A) The PPI network. (B) The clusters of PPI network. The colors represent different clusters or sets of binding sites predicted by MCODE algorithm. (C) The top 20 biological processes. (D) The top 20 cellular components. (E) The top 20 molecular functions. (F) The top 20 KEGG pathways. The bar plot and different colors show the enrichment scores [-log10 (P-value)] of the top 20 significant enrichments.](/cms/asset/92dc7b66-b545-4716-9f74-813d566b95ad/dddt_a_12184093_f0004_c.jpg)
Figure 5 CSMFCH-OA common-target network. (A) Intersection of Venn diagram: 64 targets are common to CSMFCH and OA. (B) Common-target network, including 80 nodes and 218 edges. The size of the circle represents the node degree of the target protein. Purple nodes and pink nodes stand for bioactive components from CS and MF, respectively. Yellow node stands for the common components from CS and MF. Blue nodes stand for targets.
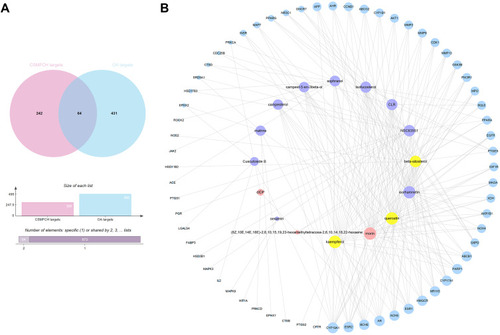
Figure 6 The PPI network and cluster analysis. (A) The PPI information generated by the STRING database. (B) The PPI network visualized using the Cytoscape software. (C) Cluster 1 (score = 9.6). (D) Cluster 2 (score = 5.455). (E) Cluster 3 (score = 3.333). (F) Cluster 4 (score = 3). The size and color of the node represent the degree of the target protein. The width and color of the edge represent the combined score of the target protein.
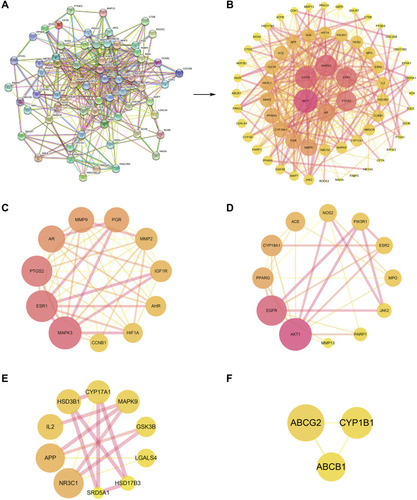
Figure 7 GO and KEGG pathway enrichment analyses of the PPI network (p-value ≤ 0.05). (A) The top 20 biological processes. (B) The top 20 cellular components. (C) The top 20 molecular functions. (D) The top 20 KEGG pathways. The color scales indicate the different thresholds for the p-values. (E and G) The GO enrichment of the PPI network using the ClueGo plugin. Show only pathways with ***P≤0.001. (F and H) The KEGG pathway analysis of the PPI network using the ClueGo plugin. Show only pathways with *P≤0.05.
Figure 8 GO and KEGG pathway enrichment analyses of the clusters (p-value ≤ 0.05). (A) The top 20 biological processes for cluster 1. (B) The top 20 KEGG pathways for cluster 1. (C) The top 20 biological processes for cluster 2. (D) The top 20 KEGG pathways for cluster 2. (E) The top 20 biological processes for cluster 3. (F) The top 20 KEGG pathways for cluster 3. (G) The top 20 biological processes for cluster 4. (H) Nine KEGG pathways for cluster 4. The color scales indicate the different thresholds for the p-values.
Figure 9 Core component-target-pathway network. The V nodes represent the top 20 KEGG signaling pathways. The ellipse nodes represent the targets related to the pathways. The diamond nodes represent ingredients from CS, and the hexagon nodes represent ingredients from MF. The size of the circle represents the node degree of the target protein.
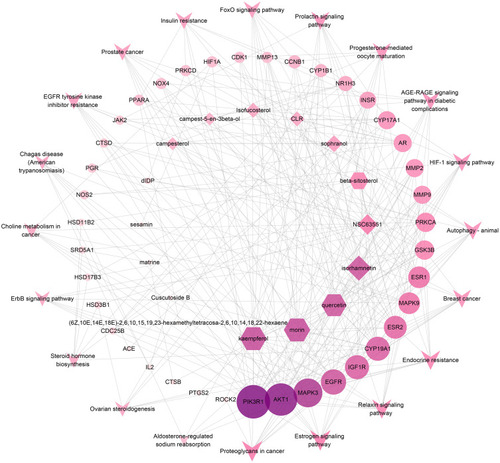
Figure 10 The molecular structure of kaempferol was shown as 2D diagrams (A) and 3D diagrams (B).
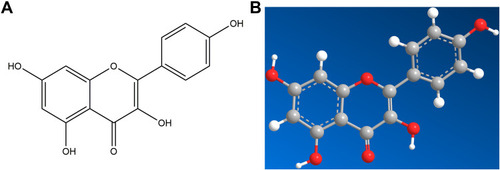
Figure 11 Estrogen signaling pathway. The red rectangle represents the targets related to the PPI network.
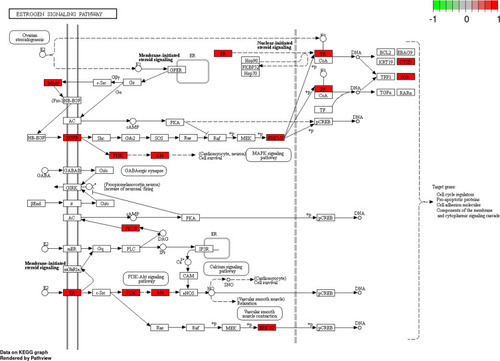
Table 3 Results of Molecular Docking Between Kaempferol and the Predicted Targets
Figure 12 Molecular models of the binding of kaempferol from CSMFCH to the predicted targets (A and B) AKT1, (C and D) EGFR, (E and F) MAPK3, (G and H) ESR1, (I and J) CYP19A1, and (K and L) AR shown as 3D diagrams and 2D diagrams.
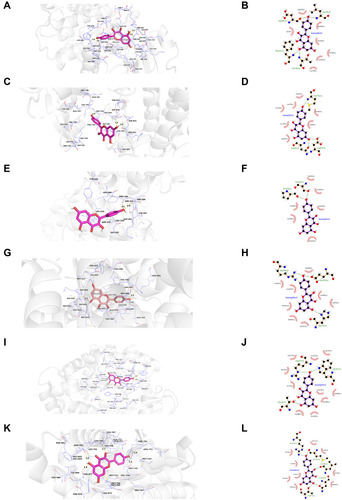
Figure 13 Mass spectrum of CSMFCH in the negative ion mode. (A) Total ion current chromatogram of CSMFCH. (B) ESI-MS/MS spectra of kaempferol.
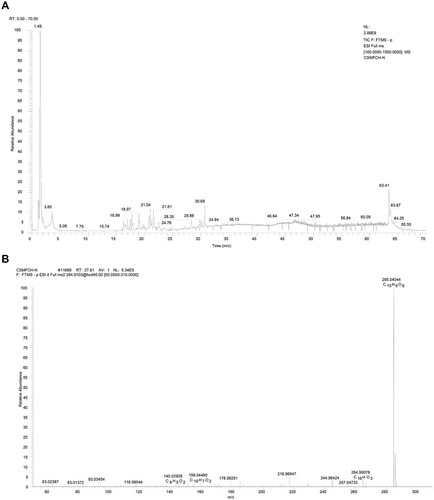
Figure 14 Mass spectrum of CSMFCH in the positive ion mode. (A) Total ion current chromatogram of CSMFCH. (B) ESI-MS/MS spectra of kaempferol.
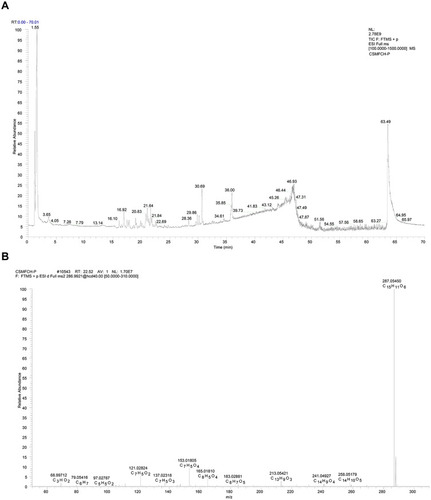
Figure 15 The absorbance and cell viability of TM3 and TM4 cells after CSMFCH and kaempferol treatment. (A) The absorbance of TM3 cells after CSMFCH treatment. (B) The cell viability of TM3 cells after CSMFCH treatment. (C) The absorbance of TM3 cells after kaempferol treatment. (D) The cell viability of TM3 cells after kaempferol treatment. (E) The absorbance of TM4 cells after CSMFCH treatment. (F) The cell viability of TM4 cells after CSMFCH treatment. (G) The absorbance of TM4 cells after kaempferol treatment. (H) The cell viability of TM4 cells after kaempferol treatment. Data: n = 6, mean ± SD, experiments performed in triplicate. *P < 0.05 and **P < 0.01 versus non-treatment control group.
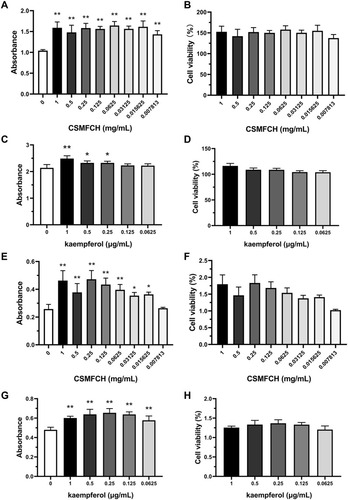
Figure 16 The body, testicular, and epididymal weight of each group. (A) The body weight. (B) The testicular weight. (C) The epididymal weight. Data: n = 6, mean ± SD, experiments performed in triplicate. ##P < 0.01 versus the NC group, *P < 0.05 and **P < 0.01 versus the MC group.
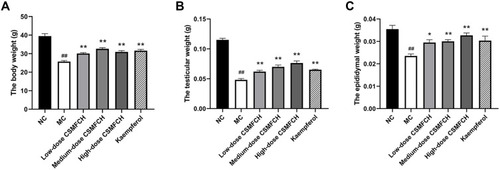
Figure 17 The sperm quality of each group. (A) The sperm density. (B) The sperm viability. (C) The sperm motility. (D) The abnormal sperm motility. Data: n = 6, mean ± SD, experiments performed in triplicate. ##P < 0.01 versus the NC group, **P < 0.01 versus the MC group.
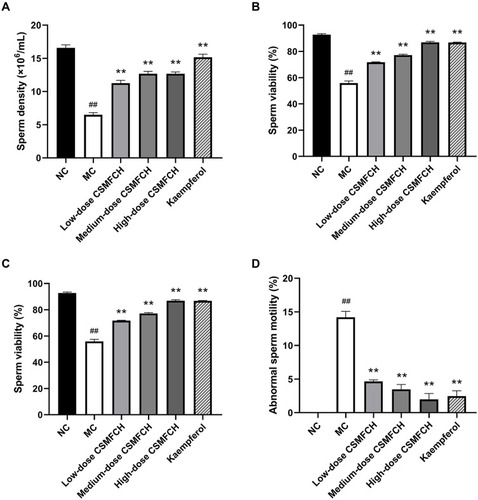
Figure 18 The sperm morphology (×400). (A) The normal control group. (B) The model control group. (C) The low-dose CSMFCH group. (D) The medium-dose CSMFCH group. (E) The high-dose CSMFCH group. (F) The kaempferol group. Data: n = 6, experiments performed in triplicate.
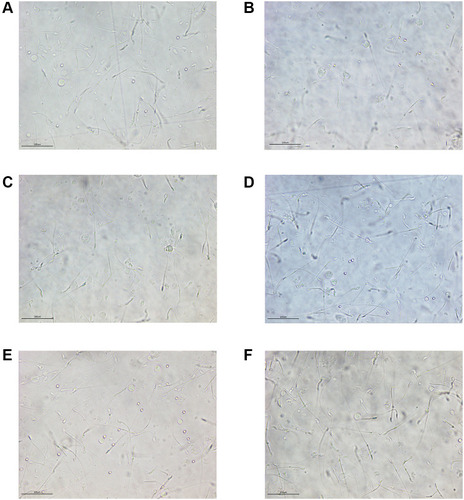
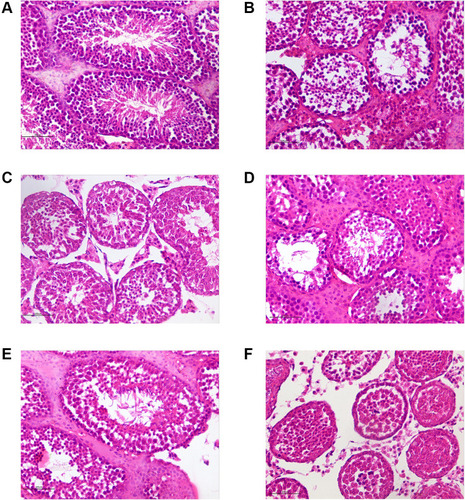
Figure 19 HE staining of testicular tissues (×400). (A) The normal control group. (B) The model control group. (C) The low-dose CSMFCH group. (D) The medium-dose CSMFCH group. (E) The high-dose CSMFCH group. (F) The kaempferol group. Data: n = 6, experiments performed in triplicate.