Figures & data
Table 1 Mathematical Model Fitting Results of LCTG
Figure 1 The photo of LCTG before and after gelation.
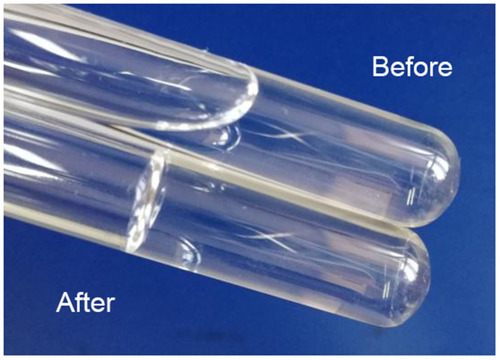
Figure 2 Cumulative release-time curve of LCTG (n = 5, ± s).
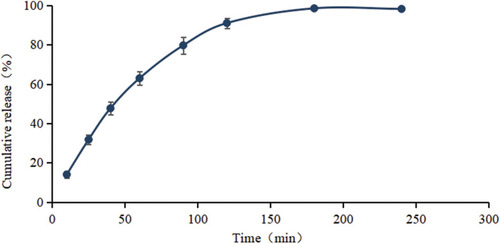
Table 2 The Comprehensive Scoring Results of Eye Irritation Response
Figure 3 The representative result of Draize test on 7th day (A:the gel group, B:the control group).
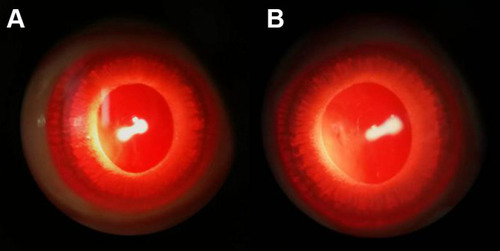
Figure 4 The representative result of FLS test on 7th day (A:the gel group, B:the control group).
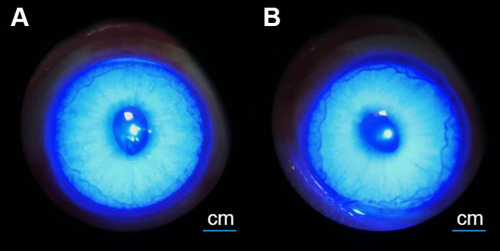
Figure 5 The corneal topographic changes (A:The gel group, B:the control group).
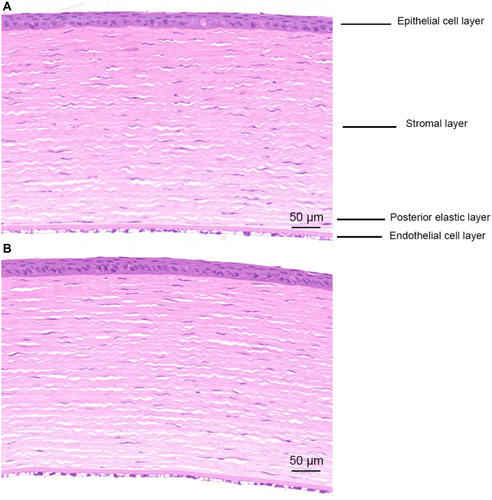
Figure 6 The FLS staining results of groups (A:the normal group, B:the model group).
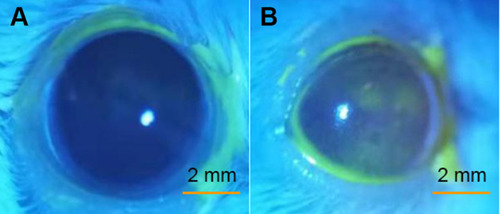
Table 3 The Quantity of Tear Fluid of Groups (Mm, n = 12, ± s)
Figure 7 The quantity of tear fluid of groups (n = 12, ± s). (N: the normal group; (M) the model group; (S) the solution group; (G) the gel group. Compare with (N)***P < 0.001, **P < 0.01; Compare with (M)###P < 0.001; Compare with (S)+++P < 0.001.).
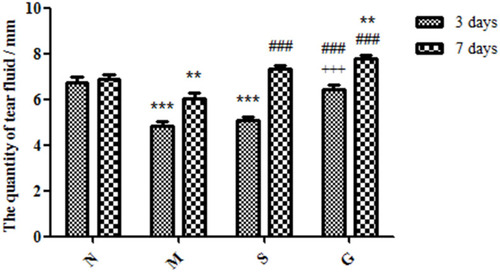
Table 4 The Consequence Score of Corneal FLS Staining (n = 12, ± s)
Figure 8 The FLS staining condition of groups (N: the normal group; (M) the model group; (S) the solution group; G: the gel group.).
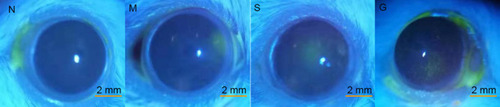
Figure 9 The consequence score of corneal FLS staining (n = 12, x ± s). (N:the normal group; (M) the model group; (S) the solution group; (G) the gel group.Compare with (N)***P < 0.001, **P < 0.01; Compare with (M)#P < 0.05).
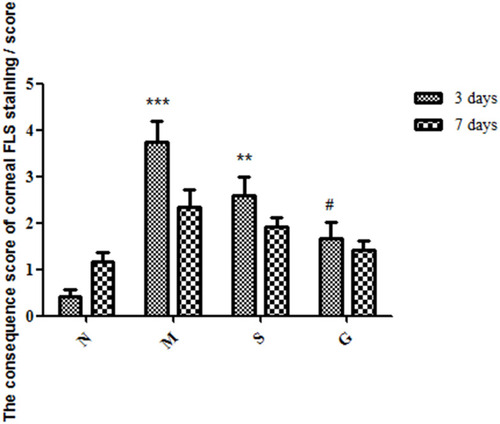
Figure 10 The form of lacrimal gland (N:the normal group; (M) the model group; (S) the solution group; (G) the gel group.).
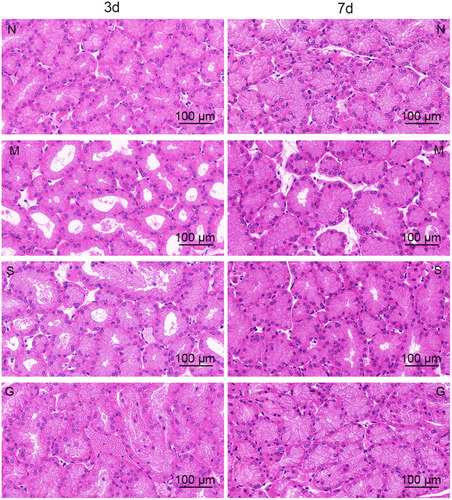
Table 5 Measurement Results of Central Corneal Epithelial Layer Thickness (μm, n = 5, ± s)
Figure 11 The form of cornea (N:the normal group; (M) the model group; (S) the solution group; (G) the gel group. The area marked by yellow line segment represented corneal epithelium layer.
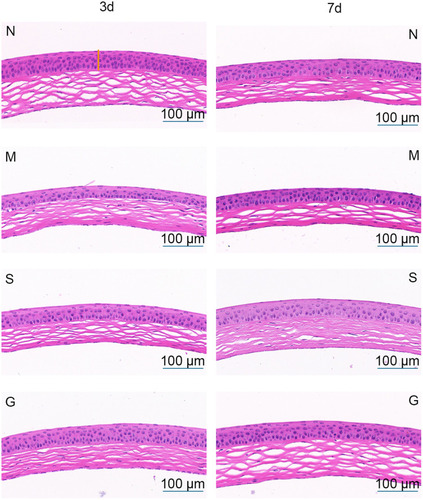
Figure 12 Measurement results of central corneal epithelial layer thickness (μm, n = 5, x ± s. (N) the normal group; (M) the model group; (S) the solution group; (G) the gel group. Compared with (N)*P < 0.05; Compared with (M) #P < 0.05).
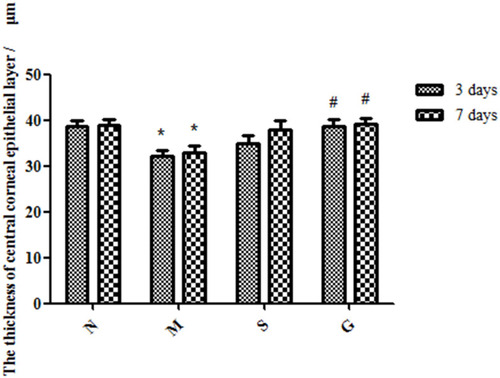
Table 6 The Apoptosis Rate of Corneal Epithelial Cells (%, n = 3, ± s)
Figure 13 The apoptosis rate of corneal epithelial cells after 3 days of the administrations (N: the normal group; (M) the model group; (S) the solution group; (G) the gel group. The green fluorescence indicated the nucleus of positive apoptotic cells while blue fluorescence represented the nucleus of other cells.).
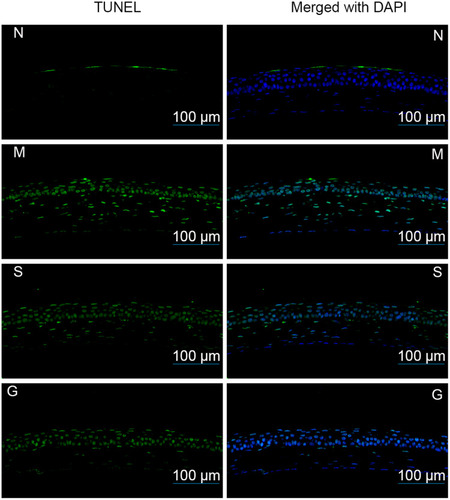
Figure 14 The apoptosis rate of corneal epithelial cells after 7 days of the administrations (N: the normal group; (M) the model group; (S) the solution group; (G) the gel group. The green fluorescence indicated the nucleus of positive apoptotic cells while blue fluorescence represented the nucleus of other cells.).
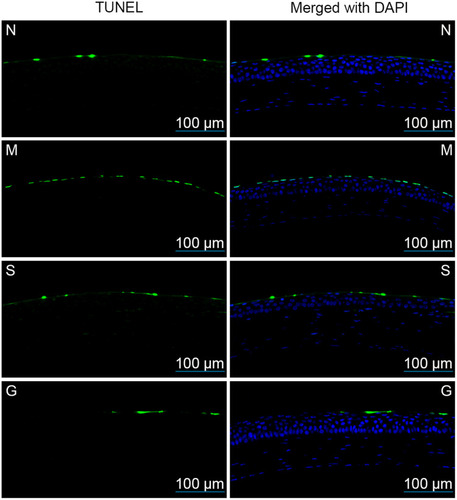
Figure 15 The apoptosis rate of corneal epithelial cells (n = 3, ± s. (N) the normal group; (M) the model group; (S) the solution group; (G) the gel group. Compared with (N)***P < 0.001, **P < 0.01; Compared with (M)#P < 0.05.).
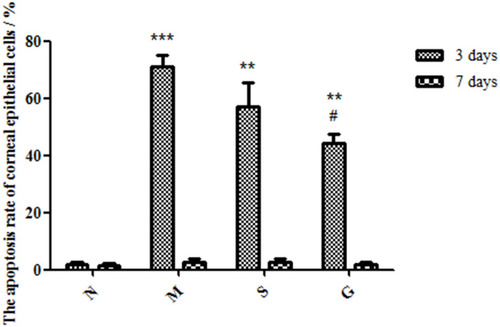
Figure 16 The expression of MMP-3 and MMP-9 in corneal epithelial cells (N: the normal group; (M) the model group; (S) the solution group; (G) the gel group. The blue fluorescence represented the nucleus.).
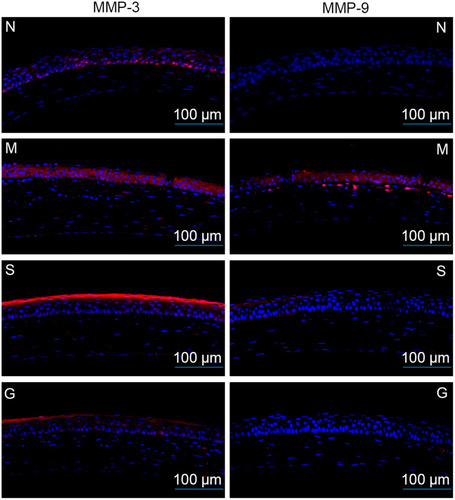
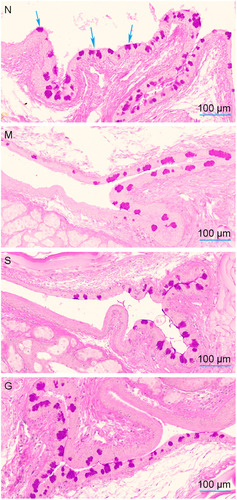
Figure 17 The conjunctival goblet cells after 7 days of the administrations (N: the normal group; (M) the model group; (S) the solution group; (G) the gel group. The blue arrows pointed to the conjunctival goblet cells.