Figures & data
Scheme 1 Schematic representation of the synthesis of NaL7 and NaL8 and its zinc (II) complexes along with numbering pattern for NMR spectroscopy.
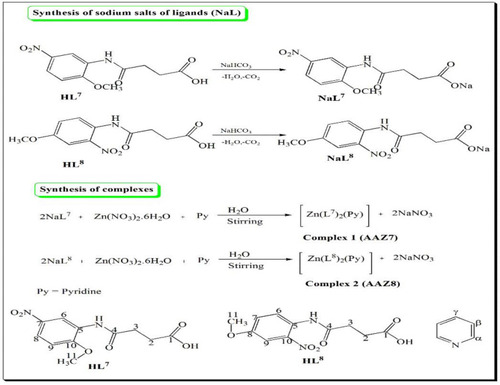
Table 1 In vitro AChE Inhibitory Values of New Compounds AAZ7 and AAZ8
Figure 1 Graph pad profile of AAZ7 and AAZ8 as AChE inhibitors.
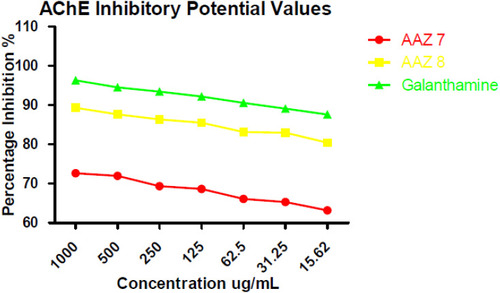
Table 2 In vitro BChE Inhibitory Values of New Compounds AAZ7 and AAZ8
Figure 2 Graph pad profile of AAZ7 and AAZ8 as BChE inhibitors.
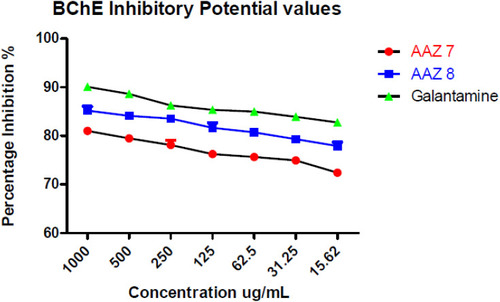
Table 3 In vitro DPPH Free Radical Scavenging Activity of New Compounds AAZ7 andAAZ8
Figure 3 Graph pad profile of AAZ7 and AAZ8 as DPPH free radical scavengers.
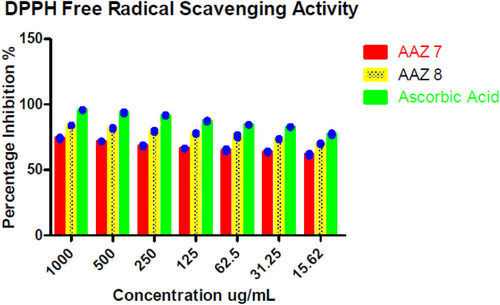
Table 4 In vitro ABTS Free Radical Scavenging Activity of Newly Synthesized AAZ7 and AAZ8
Figure 4 Graph pad profile of AAZ7 and AAZ8 as ABTS free radical scavengers.
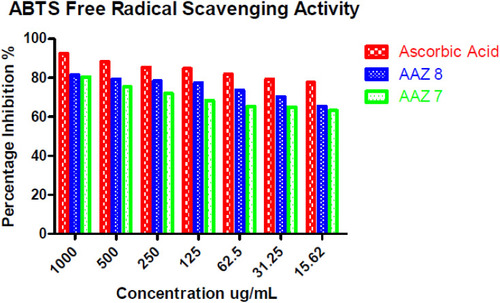
Figure 5 Docking model of AAZ7 interacting with acetylcholinesterase AChE enzyme. (A) Structure of synthesized compound AAZ7 (brown) at a specific site inside protein cartoon model (white). (B) Three dimensional display of AAZ7 (brown) with amino acid residue (blue) at the binding site with bond distance shown. (C) Two-dimensional visualization of AAZ7 at the enzyme binding site with bonding patterns and bond distance shown.
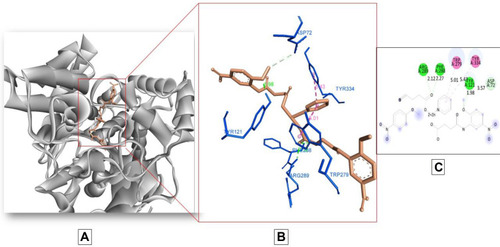
Figure 6 Docking model of AAZ7 interacting with butyrylcholinesterase BChE enzyme. (A) Structure of synthesized compound AAZ7 (red) at a specific site inside protein cartoon model (white). (B) Three- dimensional display of AAZ7 (red) with amino acid residue (green) at the binding site with bond distance shown. (C) Two-dimensional visualization of AAZ7 at the enzyme binding site with bonding patterns and bond distance shown.
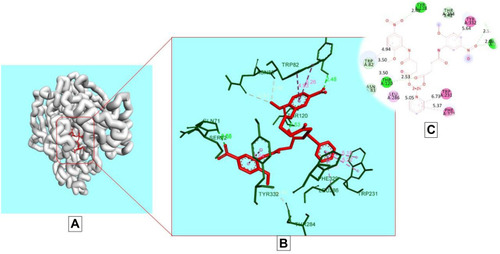
Figure 7 Docking model of AAZ8 interacting with acetylcholinesterase AChE enzyme. (A) Structure of synthesized compound AAZ8 (blue) at a specific site inside protein cartoon model (yellow).(B) Three- dimensional display of AAZ7 (blue) with amino acid residue (light blue) at the binding site with bond distance shown. (C) Two-dimensional visualization of AAZ7 at the enzyme binding site with bonding patterns and bond distance shown.
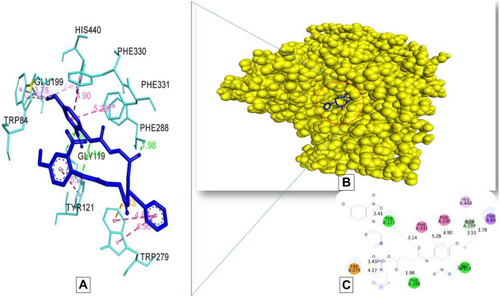
Figure 8 Docking model of AAZ8 interacting with butyrylcholinesterase BChE enzyme. (A) Structure of synthesized compound AAZ8 (green) at a specific site inside protein cartoon model (purple). (B) Three- dimensional display of AAZ8 (green) with amino acid residue (purple) at the binding site with bond distance shown. (C) Two-dimensional visualization of AAZ8 at the enzyme binding site with bonding patterns and bond distance shown.
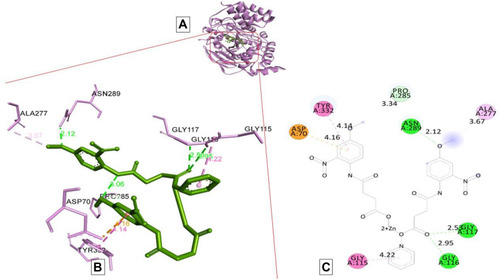
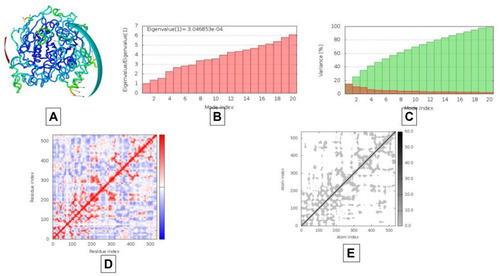
Figure 9 Results of molecular dynamics simulations of AAZ7 docked complex with BChE. (A) NMA mobility, (B) eigenvalues, (C) variance (red color represents individual variance in comparison with green color representing cumulative variance), (D) covariance map correlated in red color, uncorrelated in white color and blue color giving correlated, (E) elastic region as more grey area represents more hard regions.
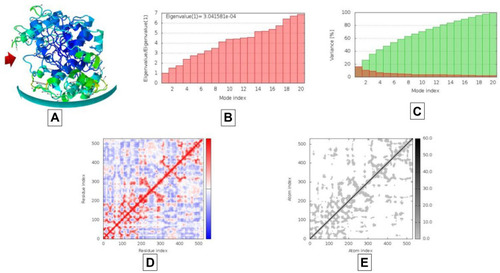
Figure 10 Results of molecular dynamics simulations of AAZ8 docked complex with AChE. (A) NMA mobility, (B) eigenvalues, (C) variance (red color represents individual variance in comparison with green color representing cumulative variance), (D) covariance map correlated in red color, uncorrelated in white color and blue color giving correlated, (E) elastic region as more grey area represents more hard regions.