Figures & data
Figure 1 Structure of INS061.
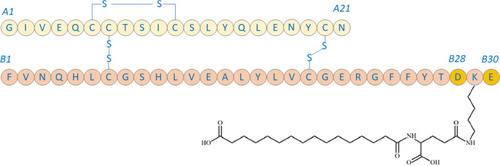
Table 1 AUC for Glucose at Different Time Periods After Subcutaneous Dosing of Insulins at a Dose of 100 Nmol/Kg in STZ-Induced Diabetic Rats (n=6)
Figure 2 Blood glucose-lowering profiles of insulins at a dose of 100 nmol/kg in STZ-induced diabetic rats. (A) Blood glucose-time profiles, (B) AUC for glucose-time profiles, ***p<0.01, ##p<0.05. The values are expressed as an average with standard deviation.
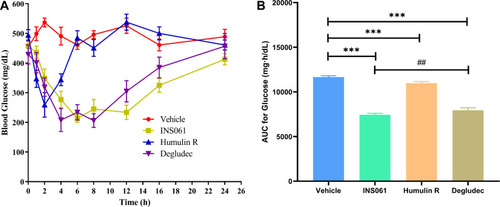
Table 2 The Mean Non-Compartmental Pharmacokinetic Parameters of 125I-INS061 After a Single Intravenous or Subcutaneous Injection in Rats by RA Method (n=6)
Table 3 The Mean Non-Compartmental Pharmacokinetic Parameters of 125I-INS061 After a Single Intravenous or Subcutaneous Injection in Rats by TCA-RA Method (n=6)
Figure 3 Mean plasma concentration-time curves of INS061 after a single subcutaneous administration at the doses of 0.75, 1.5 and 3.0 IU/kg in rats (n=6). (A) The radioactivity was determined by RA method. (B) The radioactivity was determined by TCA-RA method. (C) Comparison of mean plasma concentration-time curves determined by RA, TCA-RA and HPLC-RA methods at 1.5 IU/kg dose in rats.
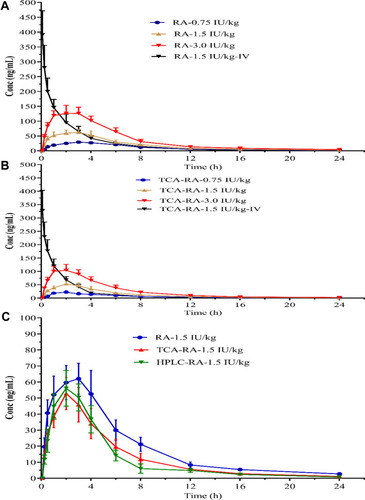
Table 4 Comparison of Main Pharmacokinetic Parameters Determined by RA, TCA-RA and HPLC-RA Methods After a Single Subcutaneous Injection of 125I-INS061 at a Dose of 1.5 IU/Kg in Rats (n=6)
Table 5 Comparison of the Tissue Distribution Determined by RA and TCA-RA Methods After Subcutaneous Injection of 125I-INS061 in Rats
Figure 4 Tissue distribution of total radioactivity at 0.5, 2, 8, and 24 h after a single subcutaneous administration at 1.5 IU/kg in rats (n=6). (A) The radioactivity was determined by RA method. (B) The radioactivity was determined by TCA-RA method.
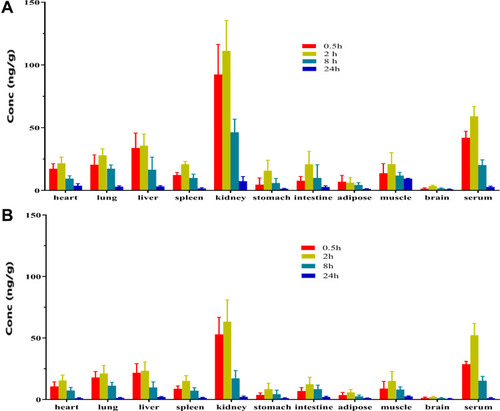
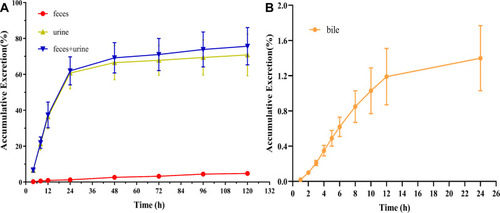
Figure 5 Cumulative excretion after subcutaneous administration of 125I-INS061 in rats. (A) urine and feces. (B) bile.