
Figures & data
Figure 1 Graphical summary of the model establishment, grouping, and treatment.
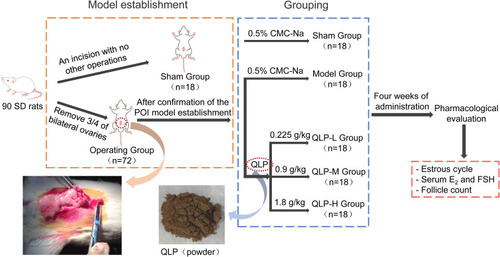
Figure 2 Effects of a bilateral partial ovariectomy on the estrous cycle in female rats. (A) Average observed days of four estrous cycle phases in one week after surgery. (B) Average observed estrus cycles in one week after surgery. **P<0.01, compared with sham group. N=18 in the sham group, N=72 in the model group.
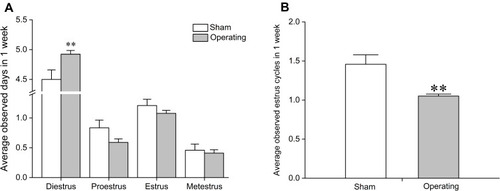
Figure 3 Effects of QLP exerted on resection-induced POI rats after 4 weeks of administration. In each group: (A) body weight changes of rats during 4 weeks of administration; (B) average observed days of four estrous cycle phases during administration; (C) average observed estrus cycles during administration; serum FSH (D) and E2 (E) levels; percentage (F) and number (G) of follicles at different stages; total follicles (H). *P<0.05, **P<0.01, compared with the sham group; #P<0.05, ##P<0.01, compared with the model group, N=18 in each group in body weight measurement, estrous cycle monitoring, and serum hormone assay; N=12 in each group in follicle count.
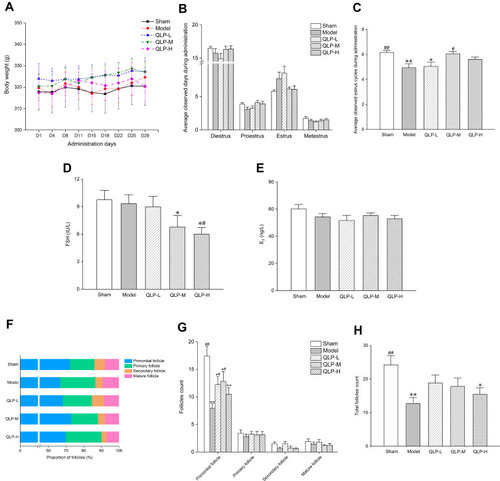
Figure 4 Compound-common target network. The green-colored nodes in the network represent the common targets, the red arrow-shaped nodes indicate the herb medicines of QLP, and the light red- and light yellow-colored nodes represent the compounds of QLP. The light yellow-colored nodes refer specifically to compounds shared by more than one herb. The size of the nodes in the network are determined by the degree value. The greater the degree value, the larger the nodes.
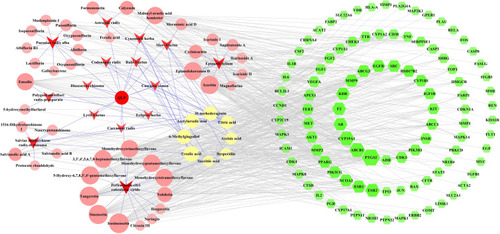
Figure 5 PPI network analysis and enrichment analysis. (A) The PPI network. The size and color changes of the nodes are determined by the degree value. The degree value presented in a descending order (large to small) corresponds to the size in a descending order (large to small) and the color spectrum ranging from bright to dark intensity. The changes of the edge width and color are determined by the combined score, which follow the same principle as the nodes. (B) GO enrichment. The X-axis represents the description of the items and the Y-axis represents the enrichment score (the negative logarithm of the p-value). (C) KEGG pathway enrichment. The size of the bubble in the graph indicates the number of common targets enriched in the pathway and the p-value in a descending order (large to small) corresponds to the bubble color spectrum ranging from blue to red. The X-axis represents the gene ratio and the Y-axis represents the description of the pathways. (D) The target-pathway network. The green-colored nodes in the figure represent the targets and the blue-colored nodes represent the pathways.
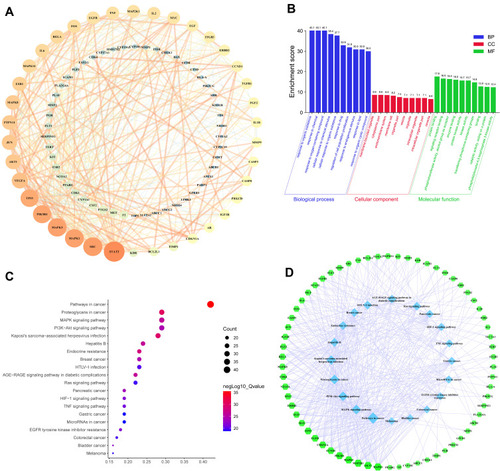
Figure 6 Common targets (highlighted in red) that enriched in the MAPK and PI3K-AKT signaling pathways. (A) MAPK signaling pathway in KEGG database. (B) PI3K-AKT signaling pathway in KEGG database.
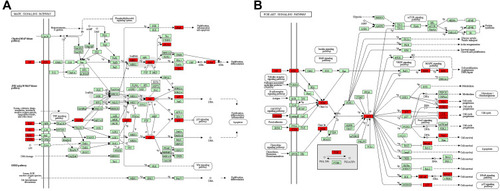
Figure 7 Western blot analysis. (A) Expression levels of p-ERK, ERK, p-JNK, JNK, p-p38, p38, p-AKT, and AKT in the rat ovaries deduced by Western blot analysis. (B) Statistical results of p-ERK/ERK, ERK, p-JNK/JNK, JNK, p-p38/p38, p38, p-AKT/AKT, and AKT. *P<0.05, **P<0.01, compared with the sham group; #P<0.05, ##P<0.01, compared with the model group; four animals in each group were determined.
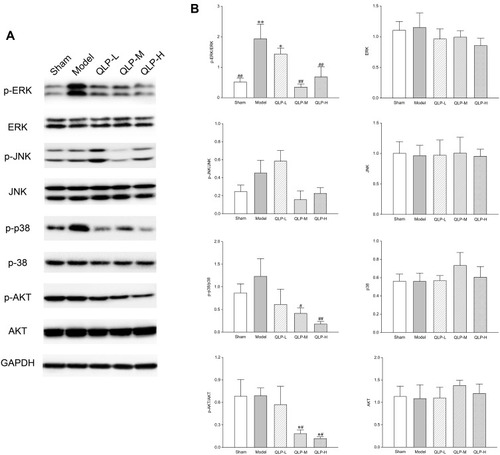
Figure 8 Compound-target-MAPK and the PI3K-AKT pathway network. The green-colored nodes in the network represent the common targets, the blue-colored nodes represent the MAPK and PI3K-AKT pathways, and the light red-colored nodes represent the compounds of QLP. The size of the nodes in the network are determined by the degree value.
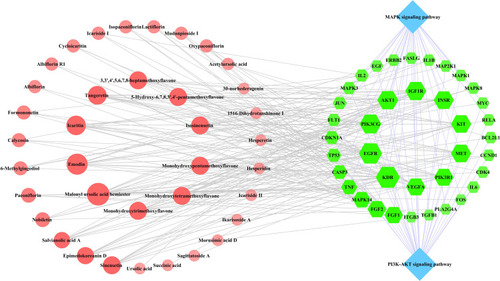
Table 1 The Attribute Value of Key Compounds and Key Targets
Table 2 Docking Results of the Key Compounds with the Key Targets