
Figures & data
Figure 1 Process overview. Firstly, the active components of HQ and DS, the shared and specific targets of all the candidate components, the shared and specific seed genes against CHD, and the shared and specific biological processes of HQ and DS against CHD were analyzed by network pharmacology. Secondly, the MI model rats were established by ligating the left anterior descending coronary artery. The synergistic and specific effects of HQ and DS on cardiac function, left ventricular myocardial infarct size, fibrosis, hypertrophy, lipid metabolism, hemorheology, and coagulation were verified by single or combined treating of HQ and DS on MI rats.
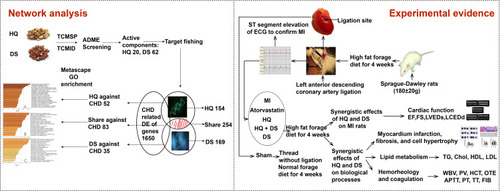
Table 1 The Active Components of HQ and DS
Figure 2 C-T network. The C-T network has 629 nodes and 1822 edges. The yellow node in the middle represents the 254 targets shared by HQ and DS. The blue diamond node on the left side represents the specific targets of HQ, and the blue diamond node on the right side represents the specific targets of DS. The pink rectangle node on the left side represents the active components of HQ, the pink rectangle node on the right side represents the active components of DS. Some names of the active components are too long, and represent by molecular ID, eg M33, 17-dodecahydro-1H-cyclopenta[a]phenanthren-3-ol; M371, 3,9-di-O-methylnissolin; M378, 7-O-methylisomucronulatol; M442, 1,7-Dihydroxy-3,9-dimethoxy pterocarpene; M1771, poriferast-5-en-3beta-ol; M1601, 1,2,5,6-tetrahydrotanshinone; M7041, 2-isopropyl-8-methylphenanthrene-3,4-dione; and M7049, 4-methylenemiltirone.
![Figure 2 C-T network. The C-T network has 629 nodes and 1822 edges. The yellow node in the middle represents the 254 targets shared by HQ and DS. The blue diamond node on the left side represents the specific targets of HQ, and the blue diamond node on the right side represents the specific targets of DS. The pink rectangle node on the left side represents the active components of HQ, the pink rectangle node on the right side represents the active components of DS. Some names of the active components are too long, and represent by molecular ID, eg M33, 17-dodecahydro-1H-cyclopenta[a]phenanthren-3-ol; M371, 3,9-di-O-methylnissolin; M378, 7-O-methylisomucronulatol; M442, 1,7-Dihydroxy-3,9-dimethoxy pterocarpene; M1771, poriferast-5-en-3beta-ol; M1601, 1,2,5,6-tetrahydrotanshinone; M7041, 2-isopropyl-8-methylphenanthrene-3,4-dione; and M7049, 4-methylenemiltirone.](/cms/asset/348ab9cd-64a2-491f-9a18-04bf79fd2170/dddt_a_12184203_f0002_c.jpg)
Figure 3 Venn diagram of the shared and specific seed genes against CHD. The diagram is composed of four sub-sets: HQ T (specific targets of HQ); DS T (specific targets of DS); HQ and DS T (shared targets of HQ and DS); CHD (CHD-related differential genes). The shared seed genes of HQ and DS against CHD are 83. The specific seed genes of HQ against CHD are 52. The specific seed genes of DS against CHD are 35.
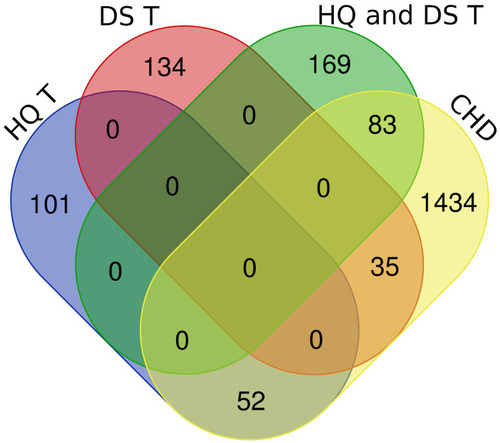
Figure 4 GO analysis of the shared and specific biological processes of HQ and DS against CHD. (A), The shared biological processes or pathways of HQ and DS against CHD; (B), The specific biological processes or pathways of HQ against CHD; (C), The specific biological processes or pathways of DS against CHD. The values of the x-axis represent -log 10 P values. The higher the value the more significant the biological processes or pathways.
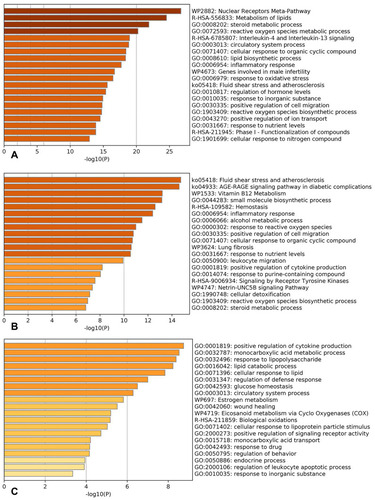
Table 2 Effect of HQ and DS on Cardiac Functional Parameters
Figure 5 The noninvasive trans-thoracic echo images of different groups The echo images were taken by VEVO 3100, the most advanced equipment for small animal cardiac function detecting: (A), Sham group; (B), MI group; (C), Atorvastatin group; (D), HQ group; (E), DS group; and (F), HQ + DS group. Measurements of the left ventricle dimensions by M-mode tracing of the left ventricle are used for the calculation of LVEF, LVFS, LVEDd, and LVEDs.
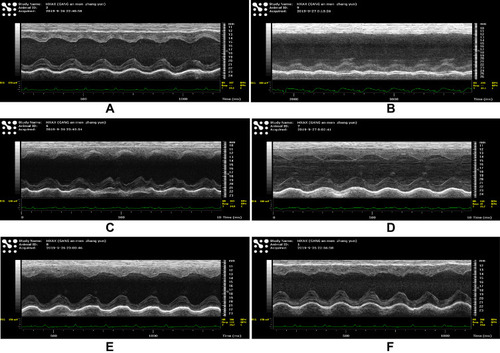
Figure 6 The TTC staining and the myocardium infarct size comparison. The photographs of TTC staining: (A), Sham group; (B), MI group; (C), Atorvastatin group; (D), HQ group; (E), DS group; and (F), HQ + DS group. (G), A bar chart of the percentage of the myocardium infarct size among groups. Values are presented as mean ± SD, n = 3. The infarct tissue was indicated in white and healthy cardiac tissue was indicated in red. The myocardial infarct size was quantified by measuring the white myocardial area/total white and red myocardial area of the left ventricular × 100%. ***p <0.001 vs Sham group; Δp <0.05, ΔΔp < 0.01 vs MI group; $P < 0.05 vs DS single treatment group.
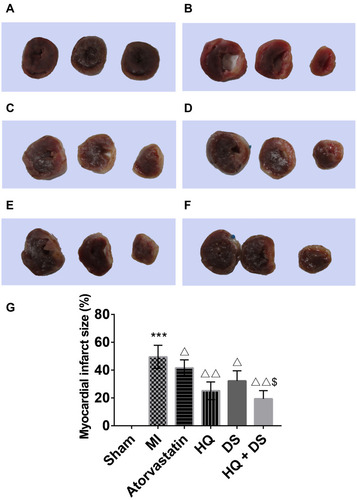
Figure 7 The images of the histological study. (A–F), The photomicrographs of myocardium fibrosis staining with Masson: (A), Sham group; (B), MI group; (C), Atorvastatin group; (D), HQ group; (E), DS group; and (F), HQ + DS group. The fibrotic tissue was indicated in blue and healthy cardiac tissue was indicated in pink. Scale bar = 40 μm. (G–L), The photomicrographs of myocardial hypertrophy staining with WGA (wheat germ agglutinin): (G), Sham group; (H), MI group; (I), Atorvastatin group; (J), HQ group; (K), DS group; and (L), HQ + DS group. The cell membranes were yellow and nuclei were blue. Scale bar = 20 μm. (M), Quantitative analysis of the percentage of myocardium fibrosis; (N), Quantitative analysis of mean cross-sectional area (CSA μm2) of LV cardiomyocytes. Values are presented as mean ± SD, n = 5. ***p<0.001 vs Sham group; Δp<0.05, ΔΔp < 0.01 vs MI group; $P < 0.05 vs DS single treatment group.
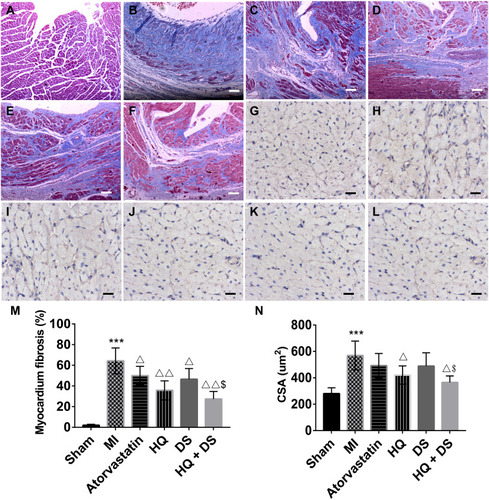
Figure 8 The survival rate of rats in the various treatment groups. The survival rate of the different treatment groups was analyzed by the Kaplan–Meier method using GraphPad Prism 6.0 software. The values of the x-axis represent time (0–28 days). The values of the y-axis represent percent survival (0–100%).
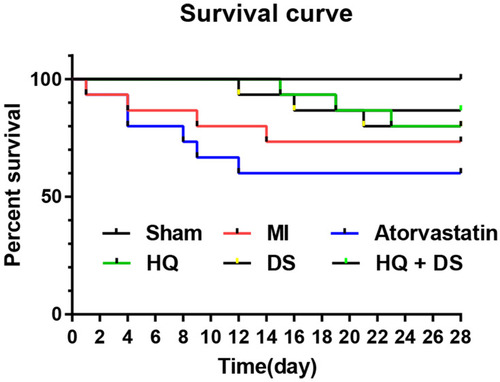
Table 3 The Serum Lipid Indexes Among Groups
Table 4 Blood Viscosity and Coagulation Index Among Groups