
Figures & data
Figure 1 The morphine-dependent rat model (Spontaneous withdrawal) and treatment of OA.
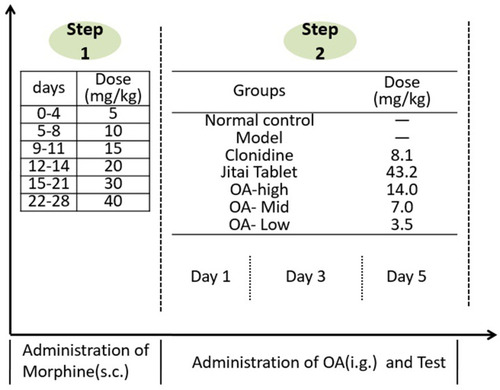
Figure 2 The morphine-dependent rat model (Naloxone-precipitated withdrawal) and treatment of OA.
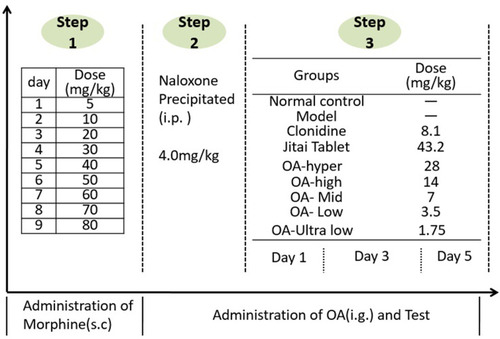
Figure 3 The morphine-dependent mouse model (Naloxone-precipitated withdrawal) and treatment of OA.
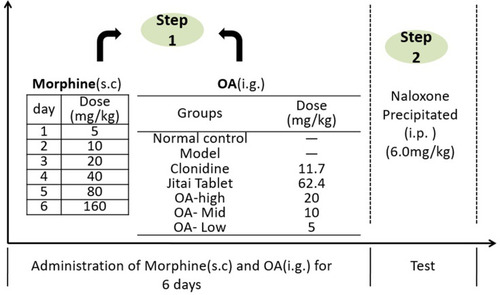
Figure 4 The experimental steps of CPP.
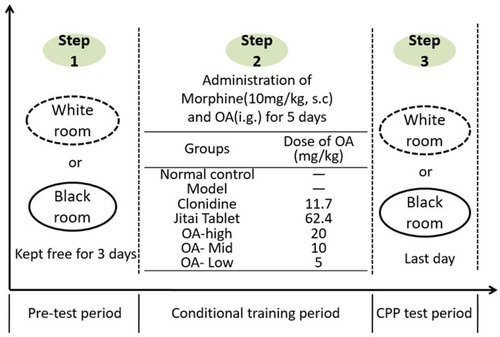
Figure 5 Effect of OA on spontaneous withdrawal score of morphine dependent rats, presented as mean ± SEM. 2h after treatment on the 1st (d1), 3rd (d3), and 5th day (d5). **P<0.01 significant differences compared with the normal control group. ##P<0.01 compared with the model group. ∆∆P<0.01 compared with the clonidine group. ☆☆P<0.01 compared with the Jitai group.
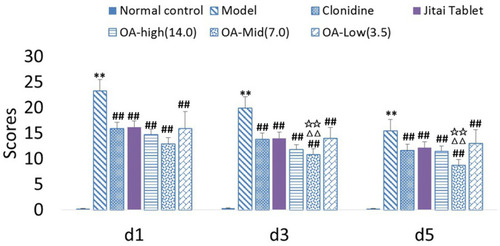
Figure 6 Effect of OA on the weight of spontaneous withdrawal morphine-dependent rats, presented as mean ± SEM. 2h after treatment on the 1st (d1), 3rd (d3), and 5thday (d5). “Before” means before administration of OA. **P<0.01 significant differences compared with the normal control group. #P<0.05, ##P<0.01 compared with the model group.
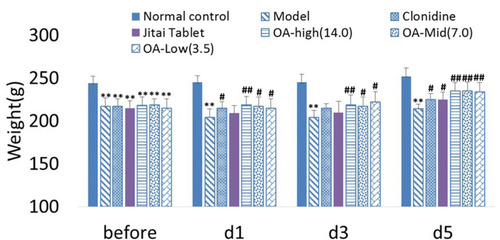
Figure 7 Effect of OA on serum 5-HT and DA levels in morphine-dependent rats with spontaneous withdrawal, presented as mean ± SEM. **P<0.01 significant differences compared with the normal control group. ##P<0.01 compared with the model group. ∆P<0.05 compared with the clonidine group. ☆P<0.05, ☆☆P<0.01 compared with the Jitai group.
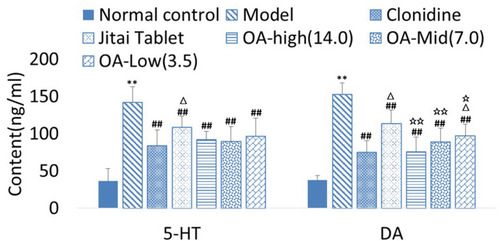
Figure 8 Effect of OA on withdrawal score of morphine dependent rats, presented as mean ± SEM. 2h after treatment on the 1st (d1), 3rd (d3), and 5th day (d5). “Before” means before administration of OA. **P<0.01 significant differences compared with the normal control group. #P<0.05, ##P<0.01 compared with the model group. ∆P<0.05, ∆∆P<0.01 compared with the clonidine group. ☆P<0.05, ☆☆P<0.01 compared with theJitai group.
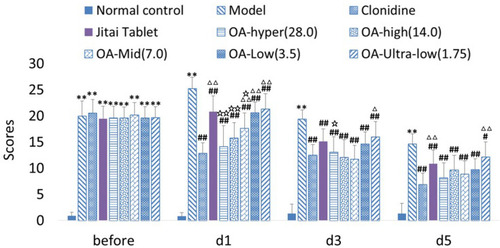
Table 1 The Effect of OA on the Content of NE, 5-HT and Endorphin in the Frontal Cortex of Morphine-Dependent Rats
Table 2 Effect of OA on the Withdrawal of Morphine Dependent Mice
Table 3 Effect of OA on the Acquisition of Morphine-Induced CPP