Figures & data
Figure 1 Schematic representation of experimental design of the study.
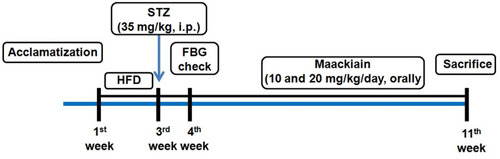
Table1 PCR Primers Used in This Paper
Figure2 The effects of maackiain metabolic parameters in HFD & low STZ induced diabetic rats. (A) Weekly body weights; (B) Food intake; (C) Water intake; (D) Fasting blood glucose levels (FBG); (E) serum insulin; (F) HOMA-IR; (G) HOMA-β cell function; (H) Glycated hemoglobin (HbA1c); (I) Total cholesterol (TC); (J) Triglycerides (TG); (K) High density lipoproteins (HDL); (L) Low density lipoproteins (LDL). The data were expressed as the mean ± S.D, n=6, **p < 0.001 and *p < 0.05 versus NC; ^^p<0.001 and ^p< 0.05 versus DC.
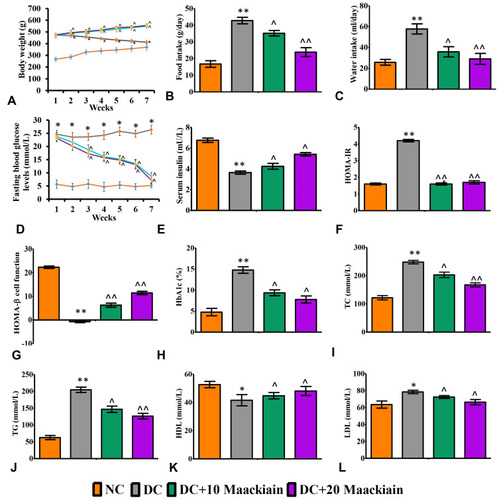
Figure3 The effects of maackiain serum and urinary renal markers in HFD & low STZ induced diabetic rats. (A) Blood urea nitrogen (BUN); (B) Serum creatinine; (C) 24-hour urine protein; (D) Serum albumin; (E) Serum urea; (F) Urinary uric acid. The data were expressed as the mean ± S.D, n=6, **p < 0.001 versus NC; ^^p<0.001 and ^p< 0.05 versus DC.
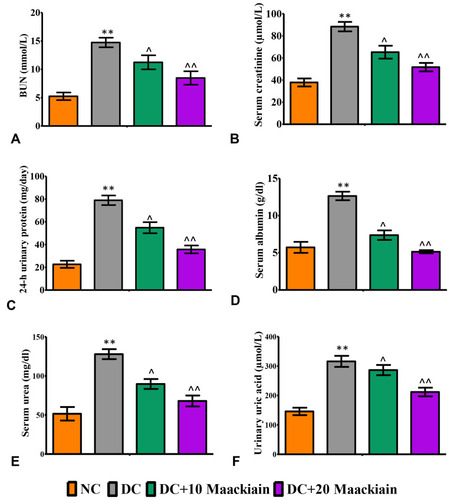
Figure4 The effects of maackiain histopathology in HFD & low STZ induced diabetic rats. (A) Hematoxylin and Eosin (H&E) staining; (B) Picro Sirius Red (PSR) staining; (C) Masson’s Trichrome (MT) staining; H& E(Black color arrow shows necrosis, Green color arrow shows thickened glomerular basement membrane, blue color arrow shows increased glomerular space). PSR and MT (Blue color triangle shows collagen deposition and yellow color arrow also shows collagen deposition). Magnification = x40; Scale bar = 100µm.
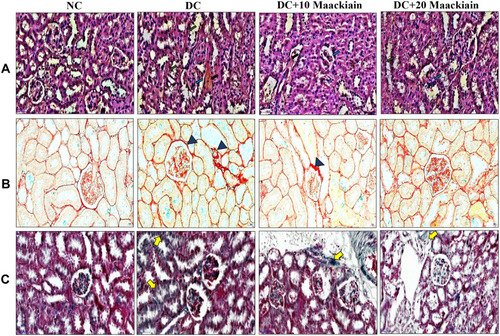
Figure5 The effects of maackiain on renal oxidative stress and antioxidant status in HFD & low STZ induced diabetic rats. (A) Lipid peroxidation product malondialdehyde (MDA) levels; (B) Reduced glutathione (GSH) content; (C) Superoxide dismutase (SOD) activity levels; (D) Catalase (CAT) activity levels in experimental rats kidney; (E) mRNA levels of Nrf2, Keap1, Nqo1, Ho-1, Gclc, Gpx in experimental rats kidney. The data were expressed as the mean ± S.D, n=6, **p < 0.001 and *p < 0.05 versus NC; ^^p<0.001 and ^p< 0.05 versus DC.
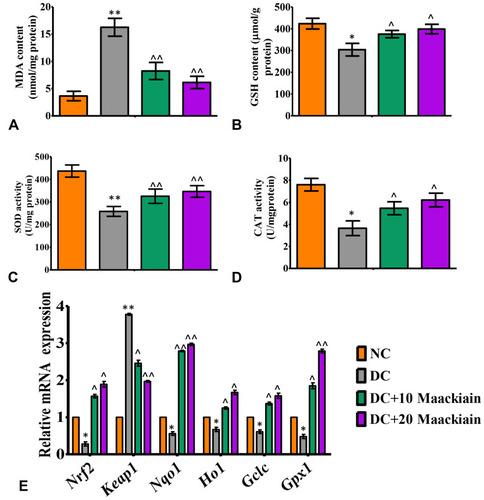
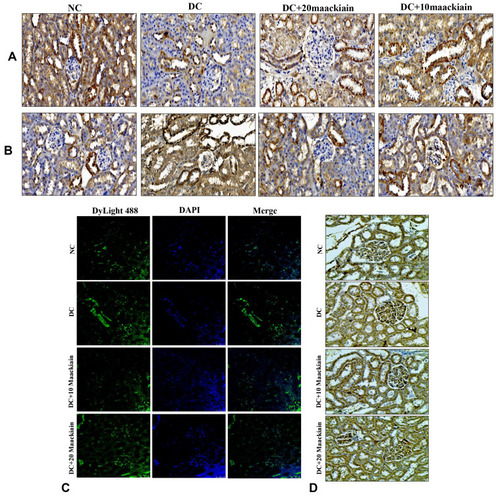
Figure6 The effects of maackiain on Nrf2/Keap-1 pathway protein destruction in HFD & low STZ induced diabetic rats. (A) Immunohistochemistry results of Nrf2; (B) Immunofluorescence double staining results of NQO-1 (red color) and HO-1 (green color); (C) Immunohistochemistry results of NOX-4; and (D) Keap-1. Magnification = x40; Scale bar = 100µm.
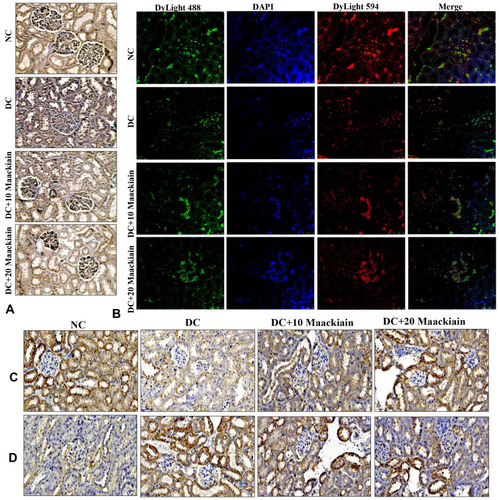
Figure7 The effects of maackiain on renal inflammatory marks in HFD & low STZ induced diabetic rats. mRNA levels of (A); Tlr4; (B) Myd88 (C) Ikbα; (D) renal NF-κB p65 (ELISA results); (E) renal TNF-α (ELISA) levels; (F) renal MCP-1 (ELISA) levels. The data were expressed as the mean ± S.D, n=6, **p < 0.001 versus NC; ^^p<0.001 and ^p< 0.05 versus DC.
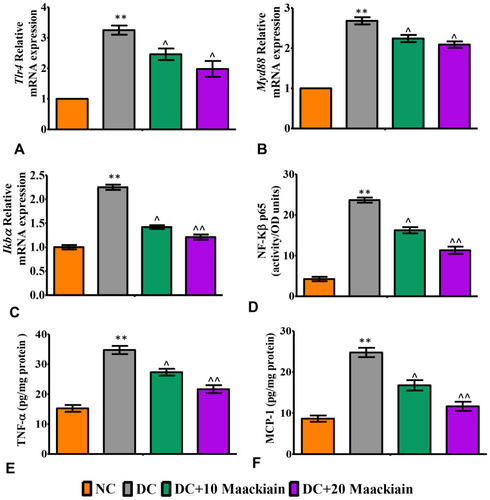
Figure8 The effects of maackiain on renal inflammatory marks in HFD & low STZ induced diabetic rats. mRNA levels of (A) Col4 (B) Tgf-β; (C) Vcam; (D) Mcp-1; (E) E-Selectin; (F) Icam gene in rental tissue of experimental rats. The data were expressed as the mean ± S.D, n=6, **p < 0.001 versus NC; ^^p<0.001 and ^p< 0.05 versus DC.
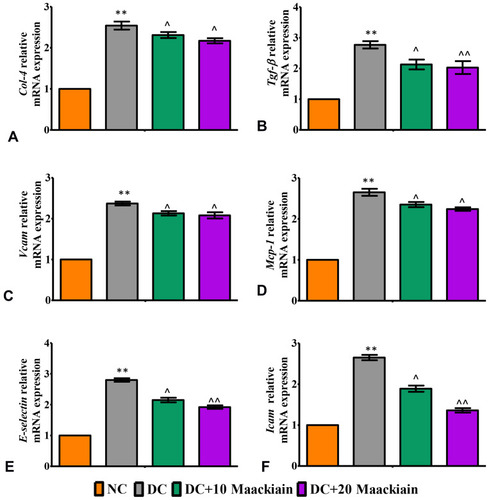
Figure9 The effects of maackiain TLR4/MYD88/NF-κB pathway protein destruction in HFD & low STZ induced diabetic rats. (A) Immunofluorescence double staining results of TLR4 (red color) and MYD88 (green color); (B) Immunohistochemistry staining results of NF-κB p65; (C) Immunofluorescence single staining results of IKBα (red color); (D) Immunohistochemistry staining results of MCP-1. Magnification = x40; Scale bar = 100µm.
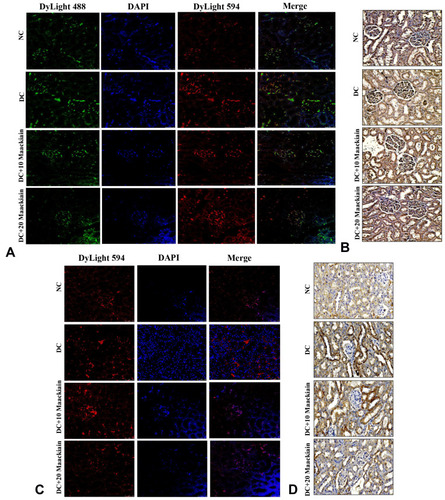
Figure10 The effects of maackiain on renal apoptosis marks in HFD & low STZ induced diabetic rats. mRNA levels of (A) Bcl-2 (B) Bax; (C) Bad; (D) Apaf-1; (E) Caspase-3; (F) Caspase-9 gene in rental tissue of experimental rats. The data were expressed as the mean ± S.D, n=6, **p < 0.001 versus NC; ^^p<0.001 and ^p< 0.05 versus DC.
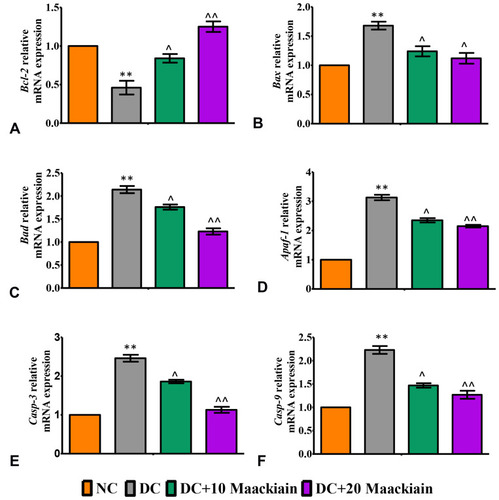
Figure11 The effects of maackiain on renal apoptosis marks in HFD & low STZ induced diabetic rats. Immunohistochemistry protein distribution of (A) Bcl-2; (B) Bax; (C) Immunofluorescence staining results of caspase-3 (green color); (D) Immunohistochemistry protein distribution of caspase-9 protein in rental tissue of experimental rats. Magnification = x40; Scale bar = 100µm.