Figures & data
Table 1 Composition of Baclofen-Meloxicam ODTs Prepared by Direct Compression Using the Selected Co-Processed Excipients
Table 2 Composition of Baclofen-Meloxicam ODTs Using Freeze-Dryer with Different Ratio of Matrix Former and Collapsing Agents
Table 3 Physical Evaluation of the ODTs Using Different Co-Processed Excipients
Figure 1 FT-IR spectrum of (A) meloxicam, (B) baclofen, (C) physical mixture of meloxicam and baclofen, (D) Prosolv ODT, (E) F-melt, (F) Pharmaburst 500, (G) physical mixture of meloxicam and Prosolv ODT, (H) physical mixture of meloxicam and F-melt, (I) physical mixture of baclofen and Prosolv ODT, (J) physical mixture of baclofen and F-melt, and (K) physical mixture of baclofen and Pharmaburst 500, (L) physical mixture of meloxicam and Pharmaburst 500.
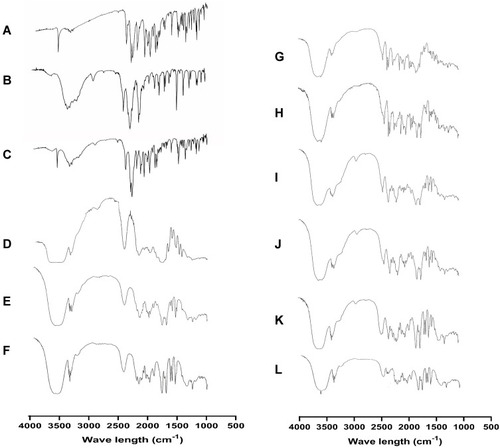
Figure 2 In-vitro dissolution profile of baclofen from prepared ODTs.
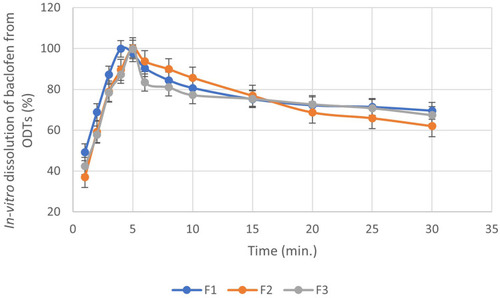
Figure 3 In-vitro dissolution profile of meloxicam from prepared ODTs.
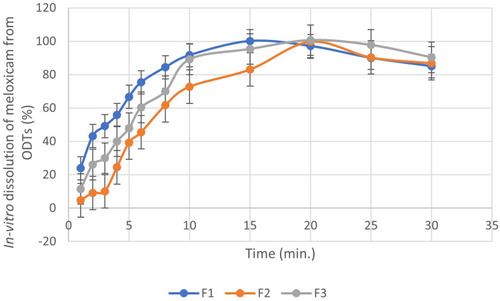
Table 4 Bitterness Taste Score of Baclofen-Meloxicam ODTs by Volunteers on Three Successive Days
Table 5 VOC Experience vs Expectation
Figure 4 Process map of recording activity.
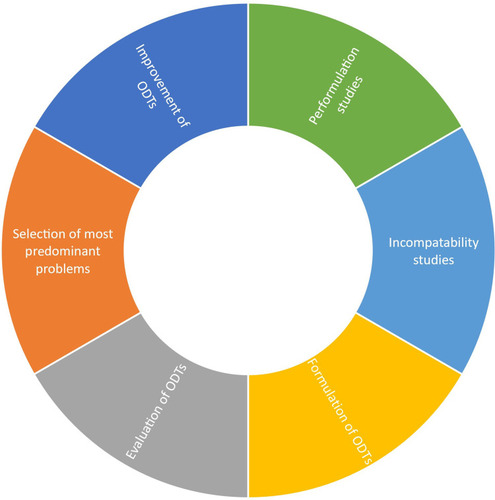
Figure 5 Process capability Cpk of palatability assessment of prepared ODTs.
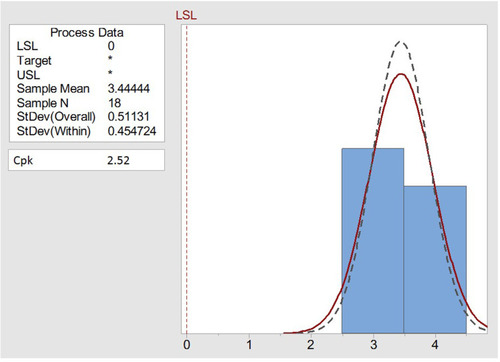
Figure 6 Process capability Cpk of meloxicam dissolution test of prepared ODTs.
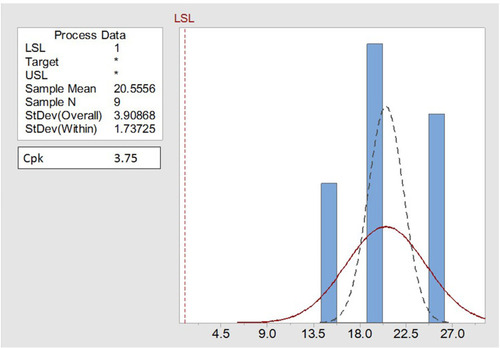
Figure 7 Pareto chart for process analysis of evaluation test of ODTs.
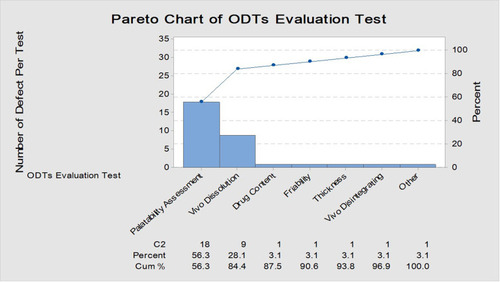
Figure 8 Cause–effect diagram of ODTs preparation.
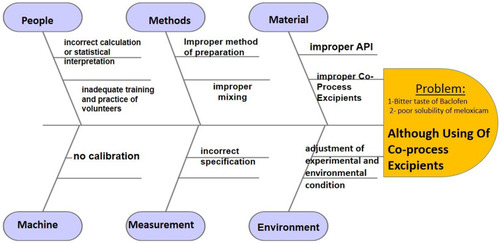
Table 6 Physical Evaluation of the Improved Baclofen-Meloxicam ODTs After Applying Six Sigma Using Lyophilization Technique
Figure 9 In-vitro dissolution profile of baclofen from improved ODTs.
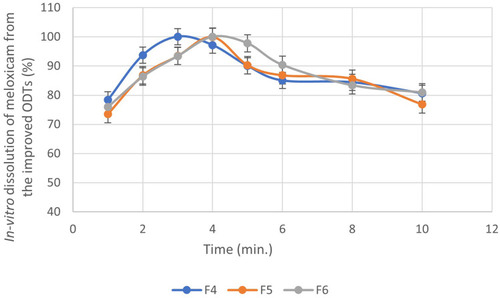
Figure 10 In-vitro dissolution profile of meloxicam from improved ODTs.
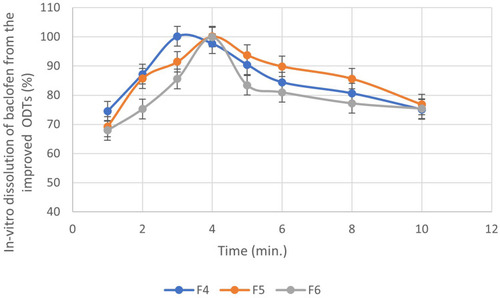
Figure 11 NP-chart of meloxicam dissolution in ODTs before improvement.
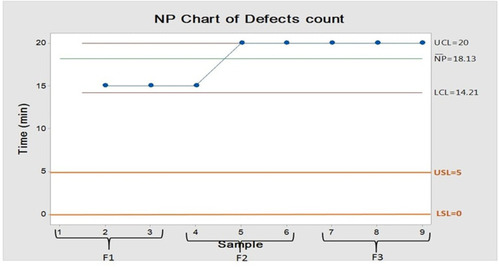
Figure 12 NP-chart of meloxicam dissolution in ODTs after improvement.
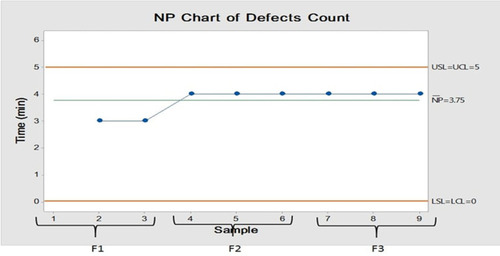
Figure 13 NP-chart of defect count of ODTs taste before improvement.
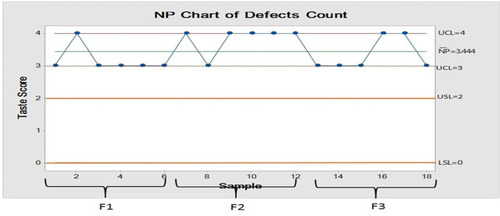
Figure 14 NP-chart of defect count of ODTs taste after improvement.
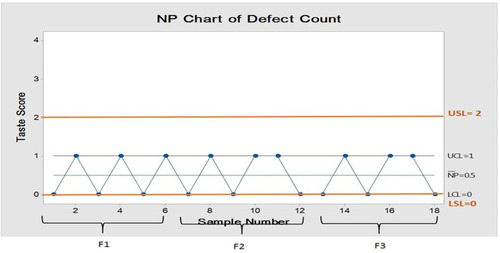
Figure 15 Differential scanning calorimetry thermograms of the raw materials and the optimal ODT formula (F4).
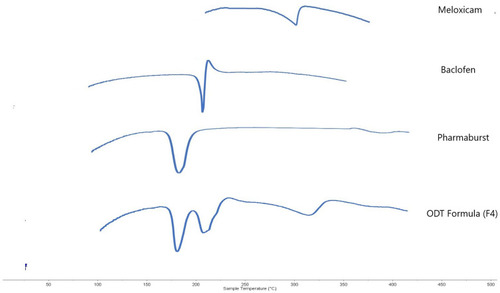
Figure 16 NP-chart of meloxicam dissolution from ODTS after one month.
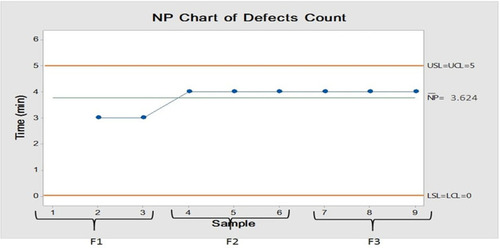
Figure 17 NP-chart of defect count of ODTs taste after one month.
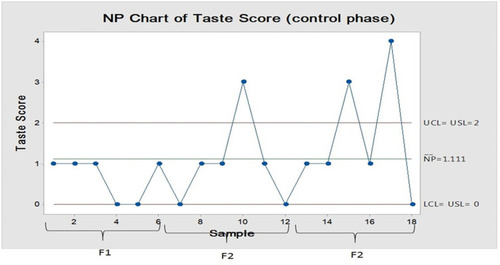
Table 7 Summary of the Pharmacokinetic Parameters of Meloxicam and Baclofen Following the Administration of Commercial Oral Tablets and the Baclofen-Meloxicam ODT
Figure 18 Mean plasma concentration–time curve of meloxicam following the oral administration of the reference Melocam tablets and the selected ODT.
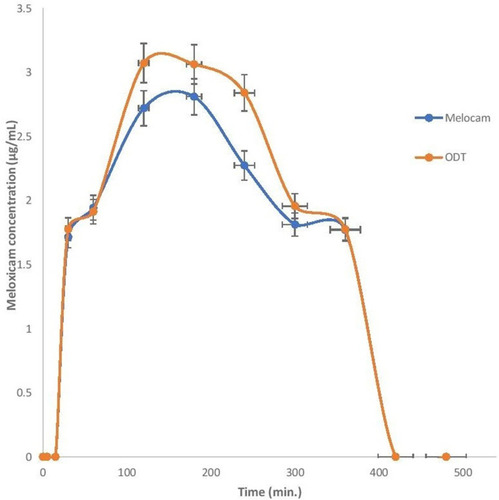
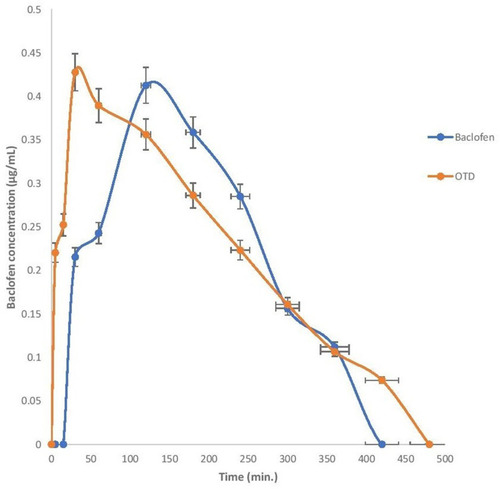
Figure 19 Mean plasma concentration–time curve of baclofen following the oral administration of the reference Baclofen tablets and the selected ODT.