Figures & data
Table 1 Factorial Design Used for the Optimization of TE Formulations
Figure 1 (A is Conc. of Ethanol, B is Type of SAA, C is Additives (Cholesterol : SAA ratio) and D is SAA : Soyabean ratio), A Graphs of solutions for optimization of Telmisartan Ethosomes, solution 1; B Graphs of solutions for optimization of Telmisartan Ethosomes, solution 2; C Graphs of solutions for optimization of Telmisartan Ethosomes, solution 3; DCar chart of desirability for optimization of telmisartan ethosomes, solution 1; E Bar chart of desirability for optimization of telmisartan ethosomes, solution 2; F Bar chart of desirability for optimization of telmisartan ethosomes, solution 3.
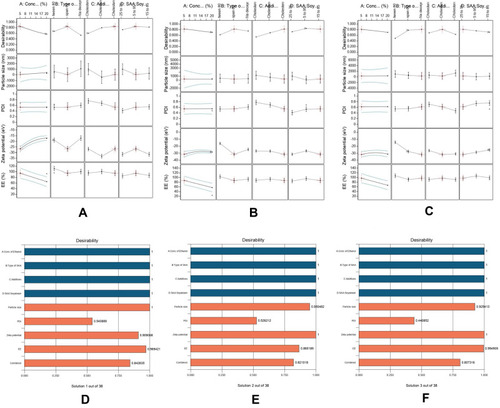
Table 2 Experimental Runs, Independent Variables, and Measured Response of the Selected Three Formulae of TEL-Loaded TEs
Figure 2 DSC Thermogram of drug (Telmisartan), polymer (Carbopol 940), drug to polymer physical mixture and formula 29
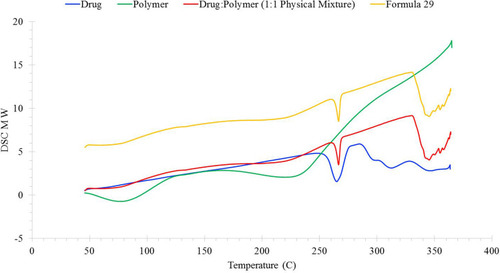
Figure 3 Fourier transform infrared (FT-IR) spectra of drug (Telmisartan), polymer (Carbopol 940) and drug& polymer physical mixture
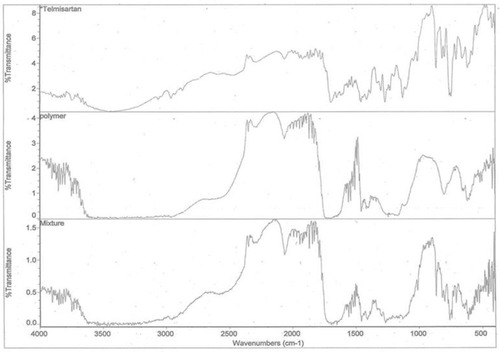
Figure 4 (Abbreviation TE, transethosome), A Transmission Electron Micrograph of TE29; B Transmission Electron Micrograph of TE31; C Transmission Electron Micrograph of TE32
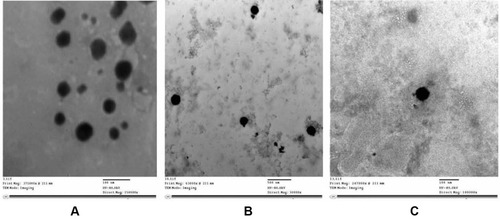
Figure 5 A In vitro drug release of transethasome different formulae vs drug suspension (mean ±SD, n=3); B Ex vivo drug permeation of transethasome different formulae vs drug suspension(mean± SD, n=3).
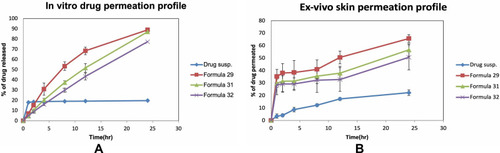
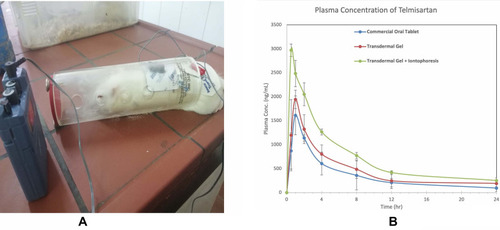
Table 3 Pharmacokinetic Parameters After Administration of TEL Oral Commercial Tablet, TEL Transethosome-Loaded Gel, and TEL Transethosome-Loaded Gel with I Iontophoresis
Figure 6 A Setting of experiment of application of Telmisartan transethosome gel Iontophoresis; B Comparative study of plasma concentration-time curve for commercial product, formula 29 and formula 29 with Iontophoresis.