Figures & data

Table 1 Coded Unit of Variables and Their Respective Levels on the Application of (41, 22) Multi-Level Factorial Design
Table 2 The Design Matrix of the Prepared Granules Formulations
Table 3 Summary of Optimization Responses
Table 4 In vitro Characterization of All Granule’s Formulation
Figure 1 Electron scanning microscope photograph (ESM). (A and C) shows formula 12 at ×35 and ×100 magnifications, respectively; (B and D) shows formula 16 at ×35 and ×100 magnifications, respectively; (E–G) shows formula 4 formula 8, and pure drug at the ×35 magnification, respectively.
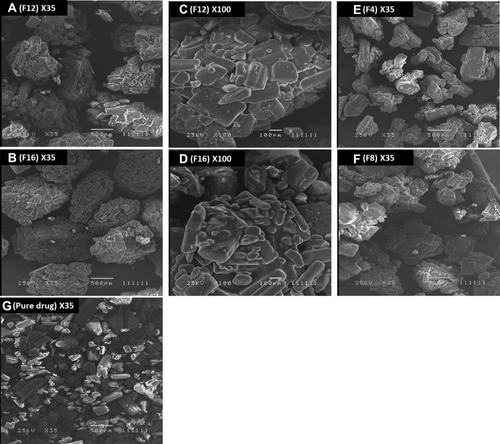
Table 5 The Optimum Formula for All Responses (F15)
Table 6 Actual Drug Content of All Formulations
Table 7 Log P Values of Pure Drug and Drug Granules
Figure 2 In vitro release profiles of pure metformin HCl and from drug granules (n=3).
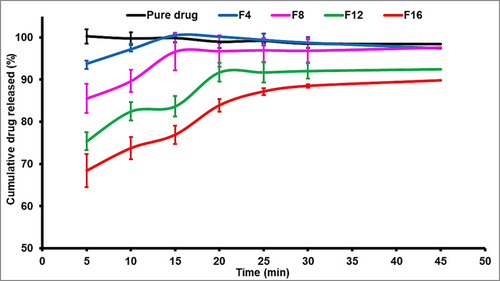
Figure 3 Differential scanning calorimetry (DSC) thermogram of the pure metformin HCl and (F2, F4, F14, and F16).
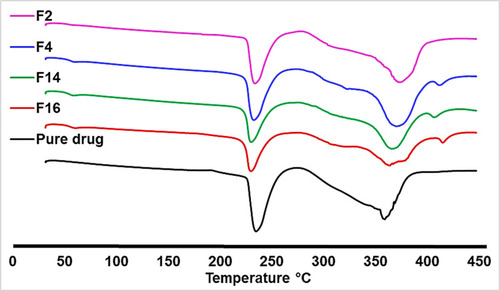
Figure 4 The permeability profiles of the pure drug and selected formulas (n=3).
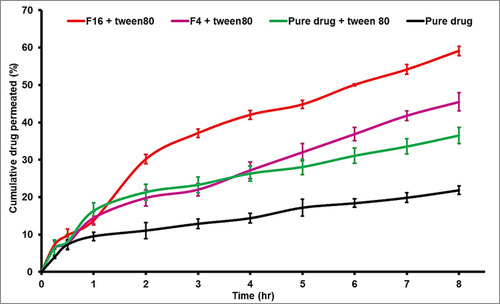
Table 8 Data of Metformin HCl Transferred Through Non-Everted Intestinal Sac (n=3)
Figure 5 The apparent permeability of metformin (mucosal -to- serosal) from pure drug and selected formulas (n=3).
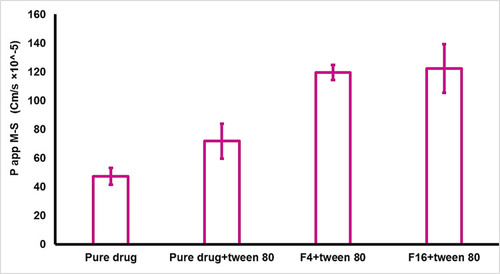
Figure 6 (A) Profiles of the change in glucose levels (mg/dl) versus time (SD error bar), (n=6). (B) Profiles of the change in glucose levels (mg/dl) versus time (SD error bar), (n=6).
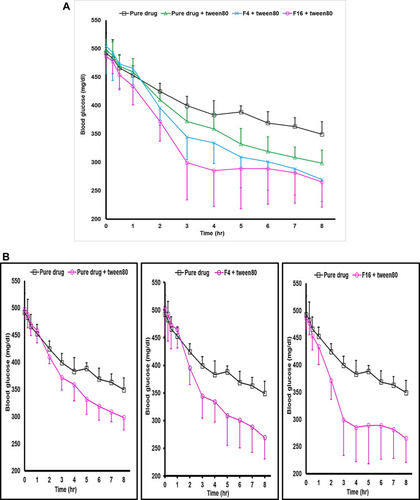
Table 9 The Blood Glucose Level of Diabetic Rats After Drug Oral Administration
Table 10 Correlation Data of Drug Permeation and Pharmacodynamic Profile
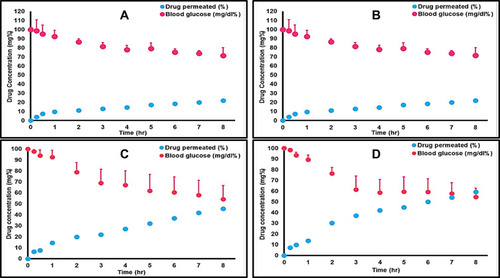
Figure 7 Point to point (level A) correlation of the drug permeation profiles and its pharmacodynamic effect: (A) Metformin HCl, (B) Metformin HCl plus tween 80, (C) Formula F4, (D) Formula F16.