Figures & data
Figure 1 The chemical structure of curcumin. MW: 358.385, BP: 591.4°C, MP: 183°C, density (g/m3, 25/4°C): 0.93.
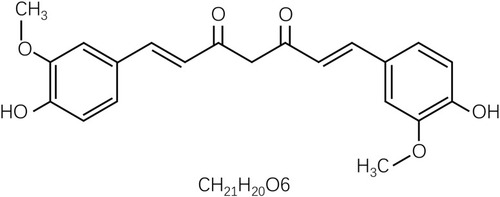
Table 1 Serum Indicators of Renal Function and Inflammation at 24h After Surgery
Figure 2 Effects of curcumin on serum Scr (a or A), Urea (b or B) and CysC (c or C) levels at 12h and 24h after CLP. At 12h and 24h after CLP, serum levels of Scr, Urea, and CysC were increased compared with the sham group. At 24h after CLP, curcumin significantly reduced serum levels of Scr and CysC. *P < 0.05 compared with sham; #P < 0.05 compared with CLP (n = 8 per group).
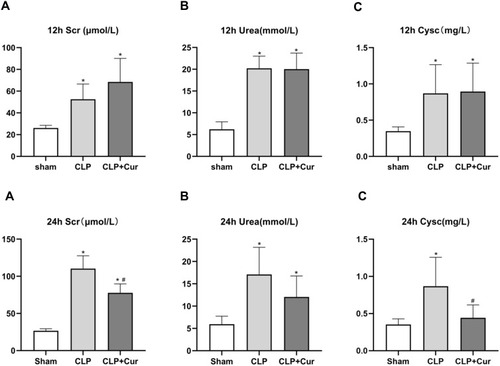
Figure 3 Effects of curcumin on serum IL-6 (a or A), TNF-α (b or B) and IL-10 (c or C) levels at 12h and 24h after CLP. At 12h and 24h after CLP, serum levels of IL-6, TNF-α, and IL-10 were increased compared with the sham group. At 24h after CLP, treatment with curcumin significantly reduced serum levels of IL-6 and TNF-α. *P < 0.05 compared with sham; #P < 0.05 compared with CLP (n = 8 per group).
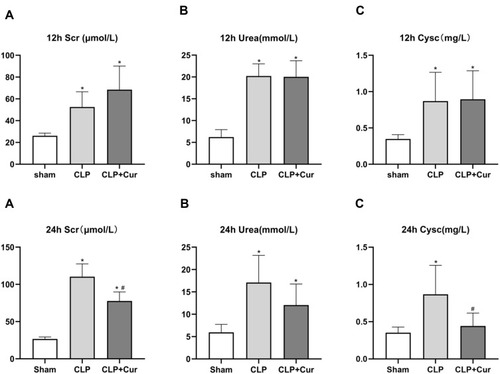
Figure 4 Heart M-mode ultrasound images. (A) Sham group at 12h. (B) CLP group at 12h. (C) CLP+Cur at 12h. (D) Sham group at 24h. (E) CLP group at 24h. (F) CLP+Cur at 24h. The stroke volume and heart rate were measured by M-mode ultrasound, and then the cardiac output was calculated.
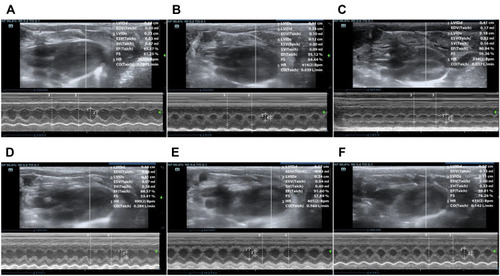
Figure 5 Effects of curcumin on cardiac output at 12h (A) and 24h (B) after CLP. At 12h and 24h after CLP, CO was decreased compared with the sham group. Curcumin had no effect on the decrease of CO at either time point. *P < 0.05 compared with sham; #P < 0.05 compared with CLP (n = 8 per group).
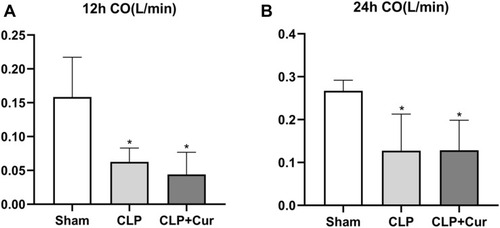
Figure 6 The comparison of Sham group (a and A), CLP group (b and B), CLP+Cur group (C and c) using renal Power Doppler and CDFI. ▲segmental artery, ⇓interlobar artery, ↖interlobular artery. Overall, blood flow at 24h after CLP (A–C) was better than 12h after CLP (a–c). The Sham group was better than CLP+Cur group and CLP+Cur group was better than CLP group. Power Doppler is more sensitive in flow detection than CDFI (n = 8 per group).
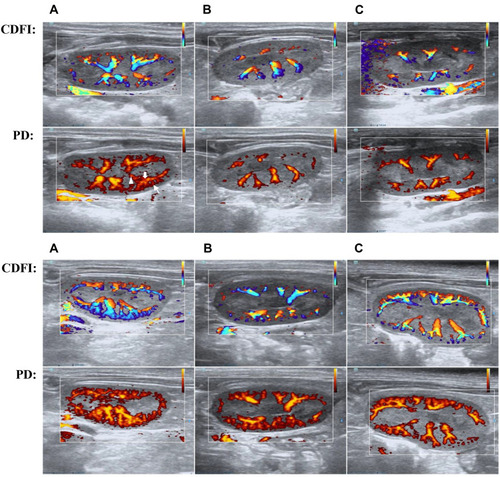
Figure 7 Contrast-Enhanced Ultrasound images. Perfusion of renal vessels, cortex and medulla and time intensity curve about the ROI. The perfusion in CLP group was weaker than that in CLP+Cur group from a macro view. (A) Sham group at 12h. (B) CLP group at 12h. (C) CLP+Cur at 12h. (D) Sham group at 24h. (E) CLP group at 24h. (F) CLP+Cur at 24h.
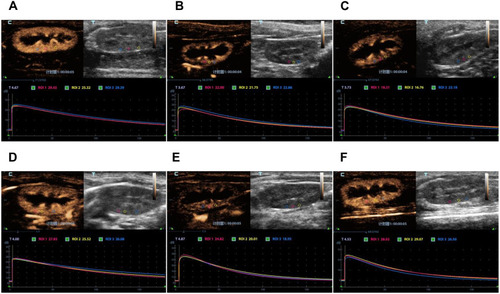
Table 2 Quantitative Parameters of CEUS in Renal Cortex at 24h After Surgery
Figure 8 Changes in CEUS values and effects of curcumin at 12h. (A) PI in CLP group was significantly decreased compared with the sham group and curcumin treatment significantly enhanced the level of PI compared with CLP (B) DS in CLP group was significantly decreased compared with the sham group, *P < 0.05 compared with sham; #P < 0.05 compared with CLP (n = 8 per group).
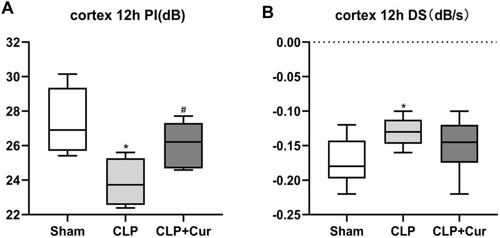
Figure 9 Changes in CEUS values and effects of curcumin at 24h. (a–e) CEUS values in renal cortex. Levels of AUC (a), PI (b), DT/2 (c) and DS (d) in the CLP group were significantly decreased compared with the sham group, AS (e) levels were significantly increased compared with the sham group. Curcumin treatment significantly increased levels of AUC, PI and DT/2 compared with the CLP group and had no effect on the increase of DS or the decrease of AS. (A–C) CEUS values in renal medulla. Levels of DT/2 (A), DS (B), AUC (C) in CLP group were significantly decreased compared with the sham group. Curcumin treatment had no effect on the decrease of DT/2, DS, AUC. *P < 0.05 compared with sham; #P < 0.05 compared with CLP (n = 8 per group).
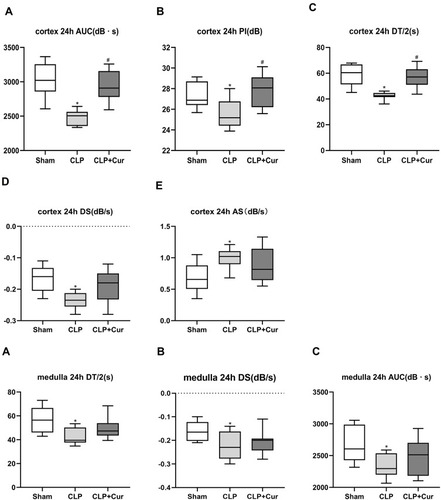
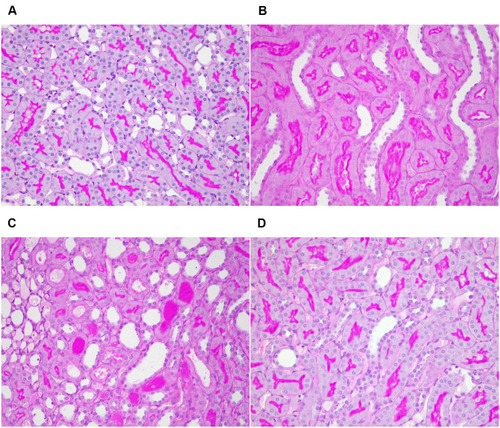
Figure 10 Light microscopy images of PAS-stained renal tissue (×400). (A) Sham group; (B) CLP group, dilatation of renal tubules, shedding of brush margin, flattening and shedding of renal tubular epithelial cells; (C) CLP group, renal tubules were formed (D) CLP+Cur group, the degree of damage was lesser than that of CLP group.