Figures & data
Figure 1 The product ion plots of methotrexate and tinidazole (IS).
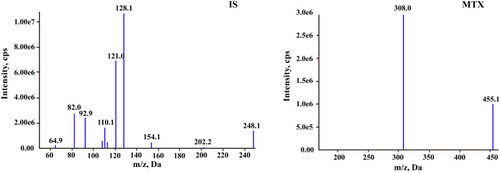
Figure 2 Typical MRM chromatograms of methotrexate and IS: (A) blank plasma sample; (B) blank plasma sample spiked with methotrexate at 5 ng/mL and IS at 100 ng/mL; and (C) real sample at 72 h after the start of MTX infusion.
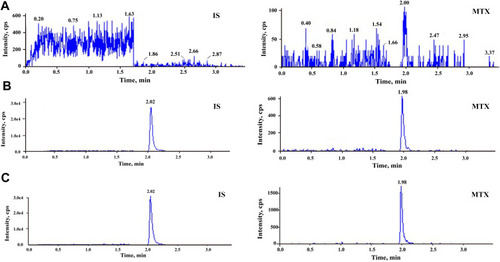
Table 1 Evaluation of the Inter- and Intra-Batch Precision by the Proposed HPLC-MS/MS Method for Determination of MTX in Human Plasma (Mean±SD, n=5)
Table 2 Extraction Recovery and Matrix Effect for Determination of MTX in Human Plasma Using the Proposed UPLC-MS/MS Method (Mean±SD, n=5)
Table 3 Summary of Stability of MTX in Human Plasma (Mean±SD, n=5)
Table 4 The Inter- and Intra-Batch Precision of Analytical Analysis Transfer (Mean±SD, n=5)
Figure 3 Mean plasma concentration distribution profile of MTX in adults and children patients after MTX infusion; the number on the histogram represents sample size at the corresponding blood sampling time point. Inset: 44–96 h plasma concentrations presentation.
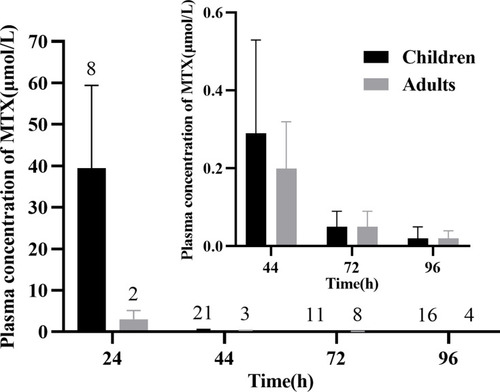
Figure 4 Plasma concentration–time profiles of MTX in two patients with delayed MTX elimination after MTX infusion. Inset: plasma concentrations below 1 μmol/L presentation.
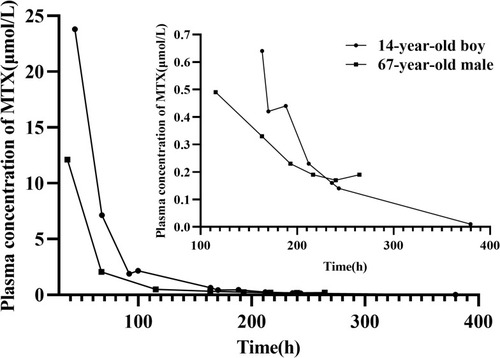
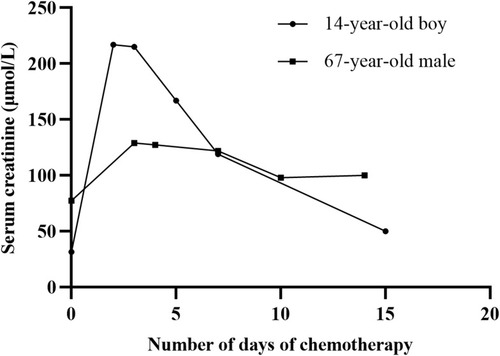
Figure 5 Serum creatinine–time profiles of MTX in two patients with delayed MTX elimination after MTX infusion.