
Figures & data
Table 1 Selected Characteristics of the Patients with KOA and Controls [(), M (25%,75%), n (%)]
Table 2 Logistc Regression Analysis of Association Between Omentin-1 Gene Val109Asp Polymorphism and Risk of KOA [n (%)]
Figure 1 Agarose gel electrophoresis for PCR products of different genotypes of the omentin-1 gene (334 bp). Val/Asp: Lane 1, 3–6, 9, 12, 13, 16; Val/Val: Lane 10, 11; Asp/Asp: Lane 2, 7, 8, 14, 15.
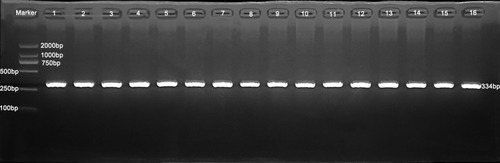
Figure 2 DNA sequence of omentin-1 gene region showing omentin-1 polymorphism in humans. DNA sequencing of the representative samples showing three genotypes (A/A, A/T and T/T) in omentin-1 gene for Val109Asp polymorphism. Among them, A/A genotype (1) is Val/Val genotype, A/T genotype (2) is Val/Asp genotype, T/T genotype (3) is Asp/Asp genotype. In the chromatogram Blue, Black, Green and Red peaks show C, G, A and T nucleotides respectively. The highlighted region in the chromatogram represents the site for Val109Asp polymorphism. Sample 1: GCAGCAAAGCAGA/ACTACCC. Sample 2: GCAGCAAAGCAGT/ACTACCC. Sample 3: GCAGCAAAGCAGT/TCTACCC.
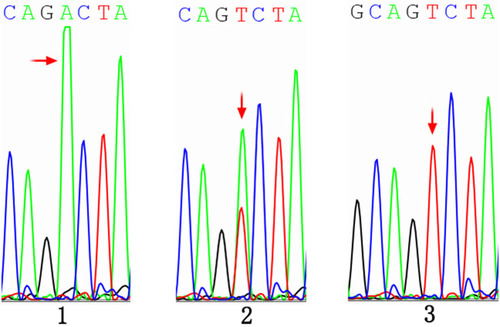
Table 3 Multivariable Linear Regression Analysis of Association Between Omentin-1 Gene Val109Asp Polymorphism and Risk of KOA Stratified by BMI
Table 4 Multivariable Linear Regression Analysis of Association Between Omentin-1 Gene Val109Asp Polymorphism and Risk of KOA Stratified by Age
Table 5 Comparison of Clinical Parameters of Different Genotypes in KOA Patients and Controls [(), M (25%,75%), n (%)]
Table 6 Comparison of the Levels of Synovial Fluid Omentin-1, IL-1β, IL-6 and CRP Among Different Genotypes in KOA Patients [M (25%,75%)]
Table 7 Comparison of the Expressions of IL-1 β, IL-6, MMP-13, Collagen-I and Collagen-III in Articular Cartilage of Knee Joint Among Different Genotypes in KOA Patients [M (25%,75%)]